Hello, i am trying to run PCA but somehow it is not running properly. If someone can please help me. Code and data attached:
Code
library(FactoMineR)
library(Factoshiny)
#> Warning: package 'Factoshiny' was built under R version 4.0.2
#> Loading required package: shiny
#> Warning: package 'shiny' was built under R version 4.0.2
#> Loading required package: FactoInvestigate
#> Warning: package 'FactoInvestigate' was built under R version 4.0.2
#> Loading required package: ggplot2
library(factoextra)
#> Warning: package 'factoextra' was built under R version 4.0.2
#> Welcome! Want to learn more? See two factoextra-related books at https://goo.gl/ve3WBa
library(ggpubr)
#> Warning: package 'ggpubr' was built under R version 4.0.2
df <- read.csv("F:/Figures/mfa_file.csv", stringsAsFactors = F)
colnames(df)[1] = "sample_name"
df1 <- df[,-1]
fviz_eig(res.pca)
#> Error in get_eig(X): object 'res.pca' not found
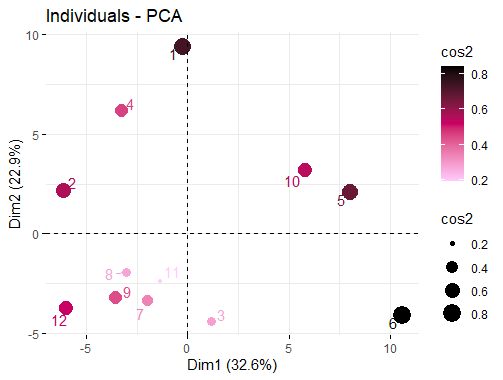
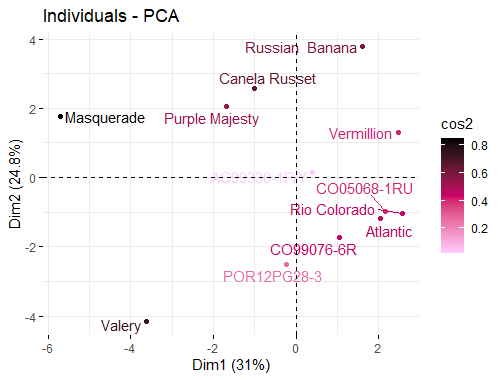
fviz_pca_ind(res.pca,
col.ind = "cos2", pointsize = "cos2",
gradient.cols = c("#FFCCFF", "#CC0066", "#000000"),
repel = TRUE)
#> Error in .get_facto_class(X): object 'res.pca' not found
Created on 2020-07-07 by the reprex package (v0.3.0)
Data:
structure(list(ï..SampleName = c("Russian Banana", "Vermillion",
"Masquerade", "Rio Colorado", "POR12PG28-3", "Valery", "CO99076-6R",
"CO05068-1RU", "Canela Russet", "AC99330-1P/Y", "Atlantic", "Purple Majesty"
), Yellow_A = c(6, 0, 6, 1.5, 12, 13, 2, 1.5, 2, 11, 2.5, 0),
Purple_A = c(0, 1.5, 0, 0, 0, 0, 0, 0, 0, 0, 0, 7), Dullness_A = c(9,
9, 12, 11.5, 9.5, 9, 12, 11, 12, 11, 11, 11), Smoothness_A = c(4,
8, 11, 1.5, 9, 12, 12.5, 12, 12, 9, 12, 11), Gritty_A = c(2,
0, 0, 1.5, 2, 0, 0, 0, 0, 2, 0, 1.5), SweetAromatics_AR = c(1.5,
0, 0, 0, 0, 2, 0, 0, 0, 1.5, 0, 0), MustyEarthy_AR = c(3.5,
4, 4, 0, 0, 0, 0, 0, 2.5, 0, 0, 3.5), Beany_AR = c(0, 0,
0, 2, 2.5, 0, 0, 0, 0, 0, 2, 0), Potato_AR = c(9, 9, 7.5,
7.5, 8, 5, 8.5, 8, 7.5, 9, 7, 8.5), Earthy_AR = c(4, 0, 0,
0, 2, 0, 2.5, 2, 0, 0, 2, 0), Cooked_AR = c(6, 6, 3, 4, 4,
2, 4, 5, 4, 6, 3.5, 4), Cardboard_AR = c(3.5, 4, 2.5, 2.5,
3, 2, 2.5, 2.5, 2.5, 1.5, 3, 3.5), Umami_AR = c(4, 3.5, 3,
2, 3, 0, 3, 3, 3, 3.5, 2.5, 2.5), Metallic_AR = c(3L, 0L,
0L, 0L, 0L, 0L, 0L, 0L, 0L, 2L, 0L, 0L), Buttery_AR = c(2L,
0L, 0L, 0L, 0L, 0L, 0L, 0L, 0L, 0L, 0L, 0L), Vegetable.complex_AR = c(0,
0, 0, 0, 0, 0, 0, 2.5, 2, 0, 0, 0), Raw.potato.peel_AR = c(0L,
0L, 3L, 0L, 0L, 0L, 0L, 2L, 2L, 0L, 0L, 3L), Raw.Potato_AR = c(0L,
0L, 0L, 0L, 0L, 0L, 0L, 0L, 0L, 0L, 0L, 0L), Eggy_AR = c(0L,
0L, 0L, 0L, 0L, 0L, 0L, 0L, 0L, 0L, 0L, 0L), SwtPtato_AR = c(0L,
0L, 0L, 0L, 0L, 0L, 0L, 0L, 0L, 0L, 0L, 0L), Cauliflower_AR = c(2L,
0L, 0L, 0L, 3L, 0L, 0L, 0L, 0L, 0L, 2L, 0L), OverallPotatoID_F = c(9,
8, 6.5, 8, 7, 3.5, 8, 8, 8, 9, 7, 8.5)), row.names = c(NA,
12L), class = "data.frame")
 ?
?