Hello, guys!
This is my first time with Shiny and I think I still don't get how the "layout" works.
My intention is to create a website and I can't position things where I want.
What I have:
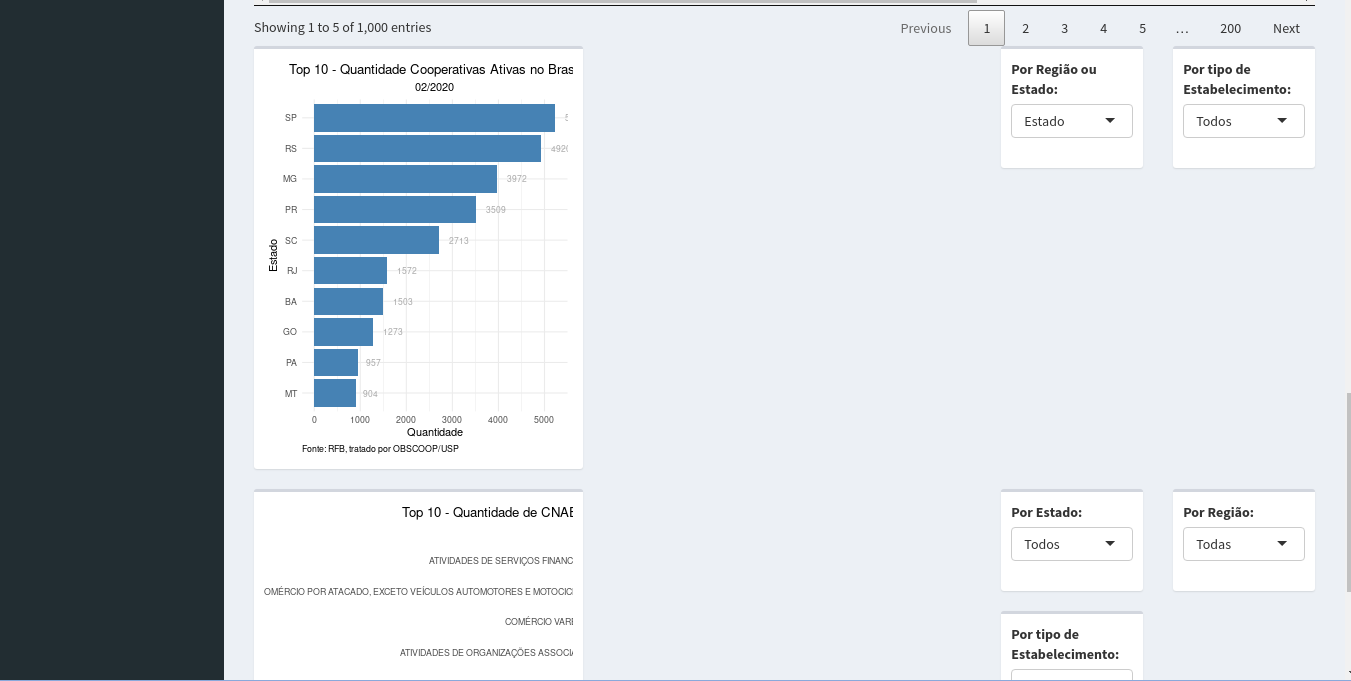
How can I improve the width of my graph till the select options? And how can put the select options one under another?
Part of my code:
                        fluidRow(
                                  column(conditionalPanel(
                                         'input.dataset === "Coop_ativas"',
                                          checkboxGroupInput("show_vars", "Selecione as variáveis:",
                                                              names(Coop_ativas), selected = names(Coop_ativas))),
                                         width = 4),

                                  column(selectizeInput("id_m_f", "Matriz (1) ou Filial (2):",
                                                      c("Todas",unique(as.character(Coop_ativas$identificador_matriz_filial))), selected = "Todas",
                                                      options = list(placeholder = 'Todas')),
                                          selectizeInput("cnae_fiscal", "Cnae Fiscal Principal:",
                                                      c("Todas",str_sort(unique(as.character(Coop_ativas$cnae_fiscal)))), selected = "Todas",
                                                      options = list(placeholder = 'Todas')),
                                          selectizeInput("desc_cnae","Descrição CNAE (divisão) Principal:",
                                                      c("Todas",str_sort(unique(as.character(Coop_ativas$descricao_cnae_divisao)))), selected = "Todas",
                                                      options = list(placeholder = 'Todas')),
                                          # selectInput("muni", "Município:",
                                          #             c("Todas",str_sort(unique(as.character(Coop_ativas$municipio)))),
                                          #                options = list(placeholder = 'Todas')),
                                          selectizeInput("est", "Estado:",
                                                      c("Todos",str_sort(unique(as.character(Coop_ativas$uf)))), selected = "Todos",
                                                      options = list(placeholder = 'Todos')),
                                          selectizeInput("regi", "Região:",
                                                      c("Todas",str_sort(unique(as.character(Coop_ativas$regiao)))), selected = "Todas",
                                                      options = list(placeholder = 'Todas')),
                                         width = 8)
                                 ),


                         mainPanel(
                                  tabsetPanel(
                                              id = 'dataset',
                                              tabPanel("Coop_ativas", DT::dataTableOutput("mytable1"))
                                              ),
                                  width = 12),

                        fluidRow(
                                  column(box(plotOutput("regiao_plot")), width=8),
                                  column(box(selectizeInput("regiao", "Por Região ou Estado:",
                                                              choices = list("Estado" = "uf", "Região" = "regiao"),
                                                              selected = "Estado",
                                                              options = list(placeholder = 'Estado'))
                                             ),
                                        box(selectizeInput("estab", "Por tipo de Estabelecimento:",
                                                        choices = list("Todos" = 3, "Matriz" = 1, "Filial" = 2),
                                                        selected = "Todos",
                                                        options = list(placeholder = 'Todos'))
                                            ),
                                  width=4),
                        ),

                        fluidRow(
                                  column(
                                          box(plotOutput("cnae_plot"), widht = 8),
                                        width = 8),
                                  column(
                                          box(selectizeInput("estad_cnae", "Por Estado:",
                                                          c("Todos",str_sort(unique(as.character(Coop_ativas$uf)))),
                                                          selected = "Todos",
                                                          options = list(placeholder = 'Todos'))),
                                          box(selectizeInput("reg_cnae", "Por Região:",
                                                          c("Todas",str_sort(unique(as.character(Coop_ativas$regiao)))),
                                                          selected = "Todas",
                                                          options = list(placeholder = 'Todas'))),
                                          box(selectizeInput("estab_cnae", "Por tipo de Estabelecimento:",
                                                          choices = list("Todas" = 3, "Matriz" = 1, "Filial" = 2),
                                                          selected = "Todos",
                                                          options = list(placeholder = 'Todos'))),
                                    width = 4)
                                 )
My plot render
output$regiao_plot <- renderPlot({

      col <- sym(input$regiao)
      mef <- as.numeric(input$estab)
      reg_cnae <- as.numeric(input$reg_cnae)

      Coop_ativas %>% filter(identificador_matriz_filial %in% (if (mef %in% c(1,2)) mef else c(1:2))) %>%
        select(!! col) %>% group_by(!! col) %>% count() %>%
        arrange(desc(n)) %>% head(10) %>%
        ggplot(aes(reorder(!! col, n), n), ) +
        geom_bar(stat="identity", fill="steelblue") +
        geom_text(aes(label=n), vjust=0.5, hjust=-0.5, color="darkgrey", size=3) +
        labs(title = "Top 10 - Quantidade Cooperativas Ativas no Brasil",
             subtitle = "02/2020",
             caption = "Fonte: RFB, tratado por OBSCOOP/USP",
             #tag = "Figure 1",
             x = ifelse(!! col == "uf",  "Estado", "Região"),
             y = "Quantidade") +
        theme_minimal() + theme(plot.title = element_text(hjust = 0.5),
                                plot.subtitle = element_text(hjust = 0.5),
                                plot.caption = element_text(hjust = 0)) +
        coord_flip()
    })
Part of my data:
structure(list(cnpj = c("35345543", "2345345", "325445324",
"235455", "234435", "2345534", "345435",
"345345", "34545", "345454"), identificador_matriz_filial = c("1",
"1", "1", "1", "1", "1", "1", "1", "1", "2"), razao_social = c("adadadadadad",
"bvbvbvbvbvb", "lolololololololo", "wqwqwqwqwqwqwqwqw", "rtrtrtrtrtrt", "iuiuiuiuiu", "kikiikikikiki, "aghaghagah", "kkkkkiiiiiiii"), nome_fantasia = c("", "sdsadasd", "asdasd",
"COOP asdas", "dsdsds COOPERATIVA", "wqeqwe", "nhnhnh", "sdfsdf", "fsfds", "nhn nhnhn RITA"), descricao_cnae_divisao = c("SERVIÇOS ESPECIALIZADOS PARA CONSTRUÇÃO",
"SERVIÇOS ESPECIALIZADOS PARA CONSTRUÇÃO", "SERVIÇOS ESPECIALIZADOS PARA CONSTRUÇÃO",
"SERVIÇOS ESPECIALIZADOS PARA CONSTRUÇÃO", "SERVIÇOS ESPECIALIZADOS PARA CONSTRUÇÃO",
"SERVIÇOS ESPECIALIZADOS PARA CONSTRUÇÃO", "SERVIÇOS ESPECIALIZADOS PARA CONSTRUÇÃO",
"SERVIÇOS ESPECIALIZADOS PARA CONSTRUÇÃO", "SERVIÇOS ESPECIALIZADOS PARA CONSTRUÇÃO",
"FABRICAÇÃO DE PRODUTOS ALIMENTÍCIOS"), cnae_fiscal = c(4399103L,
4399103L, 4399103L, 4399103L, 4399103L, 4399199L, 4399199L, 4399199L,
4399199L, 1052000L), idade = c(10, 1, 2, 1, 13, 19, 8, 8, 13,
41), municipio = c("CONSTANTINA", "BLUMENAU", "PORTAO", "PORTO ALEGRE",
"SAO LEOPOLDO", "PARINTINS", "CANGUCU", "PASSO FUNDO", "NATAL",
"NATERCIA"), uf = c("RS", "SC", "RS", "RS", "RS", "AM", "RS",
"RS", "RN", "MG"), regiao = c("Sul", "Sul", "Sul", "Sul", "Sul",
"Norte", "Sul", "Sul", "Nordeste", "Sudeste"), data_situacao_cadastral = c("2009-03-06",
"2018-05-03", "2017-12-21", "2019-01-09", "2006-12-05", "2005-11-03",
"2011-10-20", "2011-10-14", "2007-01-10", "2001-07-01"), data_inicio_atividade = structure(c(14309,
17654, 17521, 17905, 13487, 11266, 15267, 15261, 13523, 3284), class = "Date")), row.names = c(NA,
10L), class = "data.frame")