Hi! I'm trying to produce a simple plot with a facet wrap. I'm not sure why, but I can't produce any plots using this data frame.
library(ggplot2)
library(readr)
library(tidyverse)
RestorationByCommodityBP30BI150 <- read_csv("RestorationByCommodityBP30BI150.csv")
RestorationByCommodityBP30BI150 <- as.data.frame(RestorationByCommodityBP30BI150)
plot1 <- ggplot(data = RestorationByCommodityBP30BI150, aes(x = t, y = NetworkPerformanceProportion)) +
  geom_line() + facet_wrap(~g)
View(plot1)
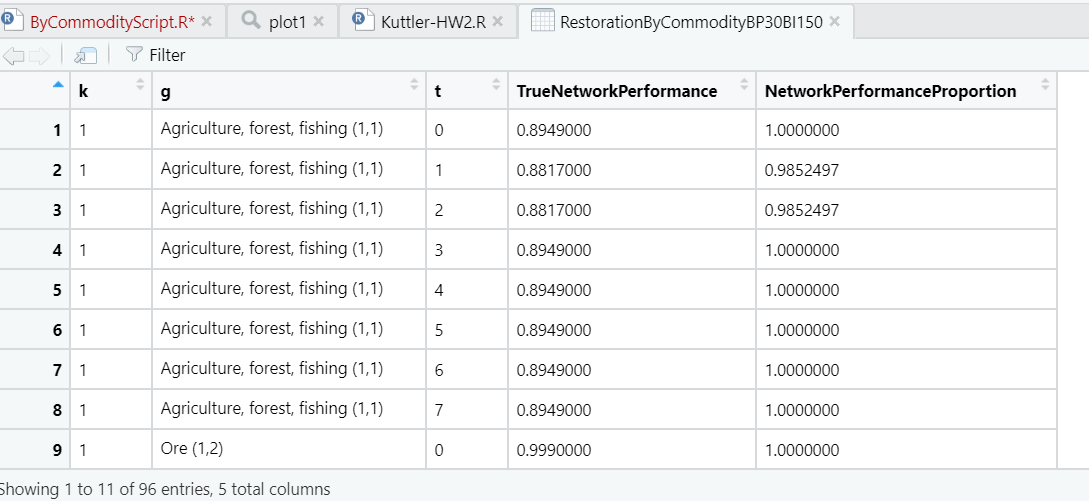
This is a snapshot of what the data frame looks like. I'm importing it using the "import from text" button on the right-hand-side.
plot1 just produces a information tab with layers, scales, etc
Thanks!