I don't know why ggplot change the order of the variables of a data frame.
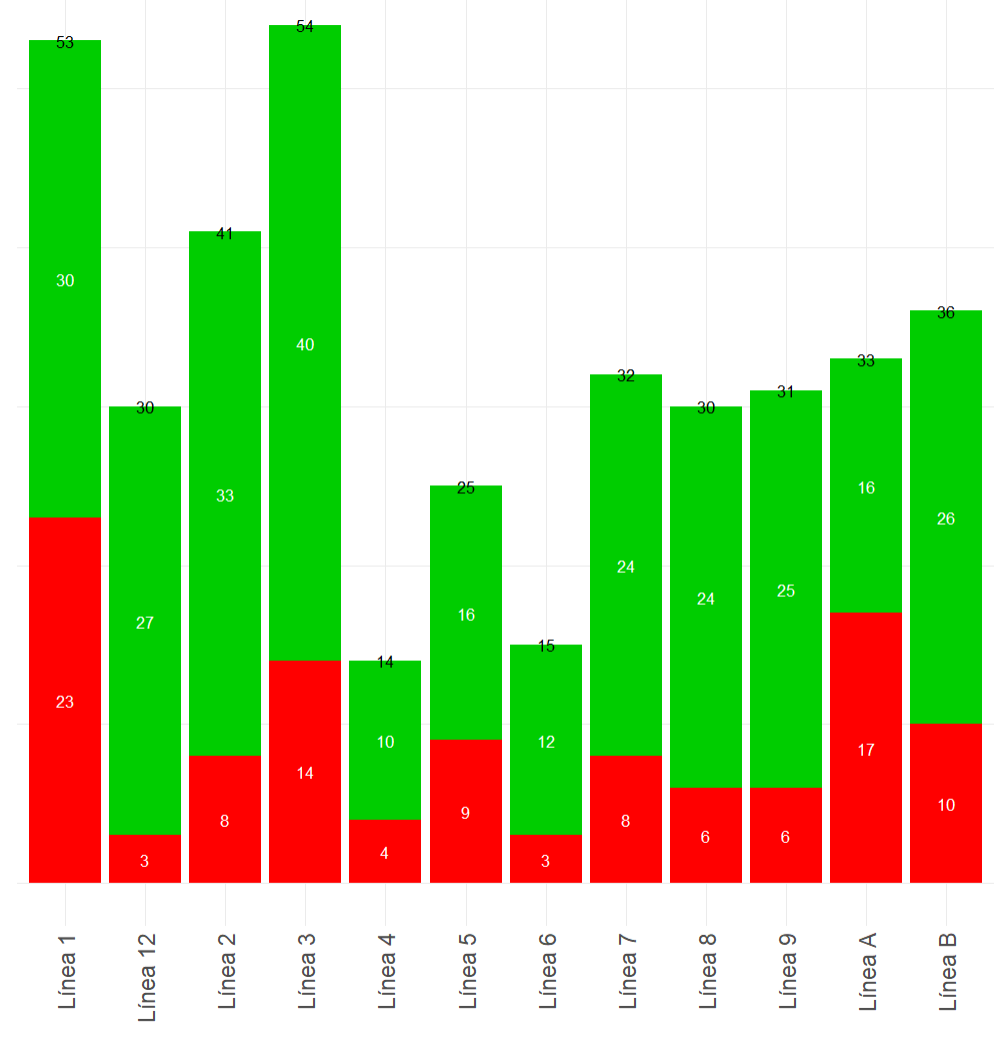
I want to plot first "Línea 1", then "Línea 2", then "Línea 3" and so on... following the order of the data frame.
But ggplot changes the order ![]()
How can I solved it?
Here is the code to create the graph:
ggplot(p3_tab1_2, aes(fill=tipo_trenes, y=trenes, x=lineas)) +
  geom_bar(position="stack", stat="identity") +
  geom_text(aes(label = trenes, group =tipo_trenes), color = "white",position = position_stack(vjust = .5)) +
  scale_fill_manual(values = c("green3", "red")) +
  theme_minimal() + ylab(" ") + xlab(" ") +
  theme(axis.text.x = element_text(angle = 90, vjust = 0.5, hjust=1),
        axis.text.y = element_blank(),
        axis.ticks = element_blank(),
        legend.position = "bottom",
        axis.text=element_text(size=15),
        legend.text = element_text(size=15)) +
  labs(fill = " ") +
  geom_text(aes(lineas, total, label = total, fill = NULL), data = trenes_totales,position = position_stack(vjust = 1))