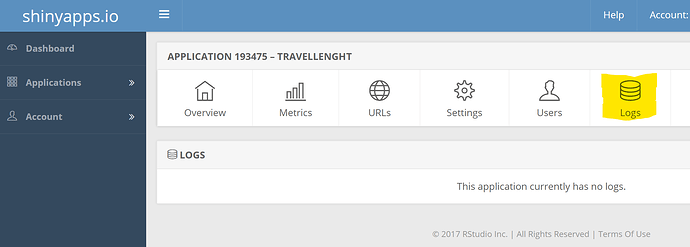
I have asked this question before on stackoverflow and is related to shiny. Perhaps there are more people used to shiny on this forum. I created a shiny app, which implements a random forest model (party package) returning results with the caret package and visualizing a conditional interference tree with the ctree function. The app works fine locally. However, when I try the publish it no output gets displayed and I get the error "An error has occurred. Check your logs or contact the app author for clarification" (see, https://snwikaij.shinyapps.io/RF_macrophyte_model/) What am I missing here?
I followed the steps described on from https://support.rstudio.com/hc/en-us/articles/229848967-Why-does-my-app-work-locally-but-not-on-shinyapps-io-, to see if this resoveld the issue, It did not
- There is no code or data stored in the local environment when running locally.
- All packages are loaded via library().
- I load the data via a relative path df <- read.csv("df.csv"). All files are stored in a map called shinyapp as app.R and the df.csv.
The output in the ui gets displayed, such as the names (i.e. selectInput(inputId = "Spec", label = "Select species:", unique(df$Taxon))) and medians. However, the plots and output of the model are not displayed and I get the previous described error.
The dataset is relatively large so I cannot display it here, but I created a dummy dataset which can be used to run the app.
library(shiny)
library(party)
library(caret)

#Create dummy dataset
df  <- data.frame(Sample = 1:500, Taxon = paste0("spec", rbinom(n = 500, 2, 0.5)), SO4 = rnorm(500, 300, 50), pH = rnorm(500, 7, 1), NO3 = rnorm(500, 10, 3))

ui <- fluidPage(
  titlePanel("Random Forest classification"),
  sidebarPanel(
    selectInput(inputId = "Spec", label = "Select species:", unique(df$Taxon)),
    selectInput(inputId = "NAN", label = "Select how to use data:", c("All data (Also NAs)", "Complete data (No NAs)")),
    numericInput(inputId = "SO4", label = "Choose value for SO4 (mg/l)", value = median(df$SO4, na.rm = T), min = 0, max = 15000),
    numericInput(inputId = "pH", label = "Choose value for pH", value = median(df$pH, na.rm = T), min = 5, max = 10),
    numericInput(inputId = "NO3", label = "Choose value for NO3 (mg/l)", value = median(df$NO3, na.rm = T), min = 0, max = 50),
    h3("Validation parameters"),
    textOutput("Validation"),
    h3("Voting percentage"),
    textOutput("Votingperc"),
    h3("Remarks"),
    h5("Note that every time the output of the model is different from
       the previous. Samples with the absence of species are more
       prevalent. Therefore, Every time the code is run, samples where a species
       was present are the same. However, samples with absences are randomly
       selected in equall amount and combines this with samples where the.
       species was present Further, the random forest model randomly creates
       trees by bootstrapping the dataset a 100 times. Each time a different
       model is created. This model is a course estimation, since many more
       important factors are absent. Validation of the model is performed by
       training the model on 75% of the dataset and validating on the other 25%.
       The predicting model is based on the total dataset. The Error:
       replacement has 1 row, data has 0, occurs when the data for a species
       has no measurements if complete data (without NAs) is used.")),
  mainPanel(plotOutput("Imp"),
            plotOutput("Tree")))

server <- function(input,output){

  #Create model dataset
  modpred           <- reactive({
    present         <- df[df$Taxon == input$Spec,]
    present$Spec    <- 1
    df1             <- df[!duplicated(df$Sample),]
    df1             <- df1[!df1$Sample %in% present$Sample,]

    if(input$NAN == "Complete data (No NAs)"){
      present <- na.omit(present)
      df1     <- na.omit(df1)}

    if((nrow(df)-nrow(present)) > nrow(present)){
      absent        <- df1[sample(1:nrow(df1), nrow(present), replace = F),]}
    else{
      absent        <- df1[sample(1:nrow(df1), nrow(present), replace = T),]}
    absent$Spec     <- 0
    model.data      <- rbind(present, absent)
    model.data$Spec <- as.factor(model.data$Spec)

    #Select 75% as training data
    prestrain       <- present[sample(1:nrow(present), floor(nrow(absent)*0.75), replace = F),]
    abstrain        <- absent[sample(1:nrow(absent), floor(nrow(present)*0.75), replace = F),]
    train.data      <- rbind(prestrain, abstrain)
    train.data$Spec <- as.factor(train.data$Spec)

    #Select the other 25% as validation data
    val.data        <- model.data[!rownames(model.data) %in% rownames(train.data),]

    #Create nice conditional interference tree on all data
    ct              <- party::ctree(Spec~SO4+pH+NO3, data = model.data)

    #Train and validate model
    train.model     <- party::cforest(Spec~SO4+pH+NO3, data=train.data, controls = party::cforest_classical(mtry = 1, ntree = 100))
    validation.mod  <- predict(train.model, newdata = val.data)
    conf.mat.val    <- table(val.data$Spec, predict(train.model, newdata = val.data))
    val.results     <- caret::confusionMatrix(conf.mat.val)
    sumval          <- paste0("AUC=", round(val.results$overall[1],2), " (LCI=", round(val.results$overall[3],2),"; ",
                              "HCI=", round(val.results$overall[4],2), "), ",
                              "Cohen's kappa=", round(val.results$overall[2],2), ", ",
                              "n-validation=", nrow(val.data), ", ", "n-training=", nrow(train.data), ", ", "n-total (model)=", nrow(model.data))

    #Extract relative importance parameters
    relimp          <- as.data.frame(party::varimp(train.model))
    relimp          <- cbind.data.frame(rownames(relimp), relimp)
    colnames(relimp)<-c("Parameter", "Relative importance")
    rownames(relimp)<- NULL
    relimp[,2]      <- relimp$`Relative importance`/sum(relimp$`Relative importance`)*100
    relimp          <- relimp[order(-relimp$`Relative importance`),]

    #Apply model on data input user interface
    model           <- party::cforest(Spec~SO4+pH+NO3, data=model.data, controls = party::cforest_classical(mtry = 1, ntree = 100))
    pred.data       <- setNames(data.frame(as.numeric(input$SO4), as.numeric(input$pH), as.numeric(input$NO3)), c("SO4", "pH", "NO3"))
    pred            <- predict(model, newdata = pred.data, type = "prob")
    prob            <- paste0("Voting percentage (Probability of presence) = ", round(pred$`1`[2]*100,0),"%", ",",
                              " Majority vote indicates = ", ifelse(pred$`1`[2] > 0.5, "Present", "Absent"))

    combo <- list(Probability = prob, Validation = sumval, Tree = ct, Importance = relimp)})

  output$Votingperc <- renderText({
    combo <- modpred()
    combo$Probability})

  output$Validation <- renderText({
    combo <- modpred()
    combo$Validation})

  output$Imp <- renderPlot({
    combo <- modpred()
    bar   <- combo$Imp
    barplot(bar$`Relative importance`,
            names.arg = bar$Parameter, ylab = "Relative importance (%)")})

  output$Tree <- renderPlot({
    combo <- modpred()
    plot(combo$Tree, inner_panel=node_inner(combo$Tree, pval = FALSE))})

}

shinyApp(ui,server)
Thank you in advance!
