---
title: "Linear Regression"
format: revealjs
editor: visual
filter: shiny
---
Introduction
This is a presentation that reads data files and runs an statistical summary and displays a plot to determine the linearity of data in the file. The data files are obtained from the R package "datasets" using the command: output$dat <- renderPrint(data(package = "datasets")$results[ , "Item"]) and manually stored in the variable "datasets".
The user selects a data file from an interactive menu first, and subsequently selects the variables in the data file to run the statistics and the regression on the selected data.
Libraries
{r}
#| label: libraries
#| echo: true
#| eval: true
suppressWarnings(suppressMessages(library(shinylive)))
suppressWarnings(suppressMessages(library(shiny)))
suppressMessages(suppressWarnings(library(rmarkdown)))
suppressMessages(suppressWarnings(library(dplyr)))
suppressMessages(suppressWarnings(library(bslib)))
Data Sets
{r}
#| label: datasets
#| echo: true
#| eval: true
datasets <- list(Formaldehyde = Formaldehyde, Indometh = Indometh,
LifeCycleSavings = LifeCycleSavings, OrchardSprays = OrchardSprays, Theoph = Theoph, chickwts = chickwts,faithful = faithful, randu = randu,ChickWeight = ChickWeight, Loblolly = Loblolly, anscombe = anscombe, beaver1 = beaver1, nottem = nottem,
stackloss = stackloss, swiss = swiss, DNase = DNase,
Nile = Nile, mtcars = mtcars, trees = trees)
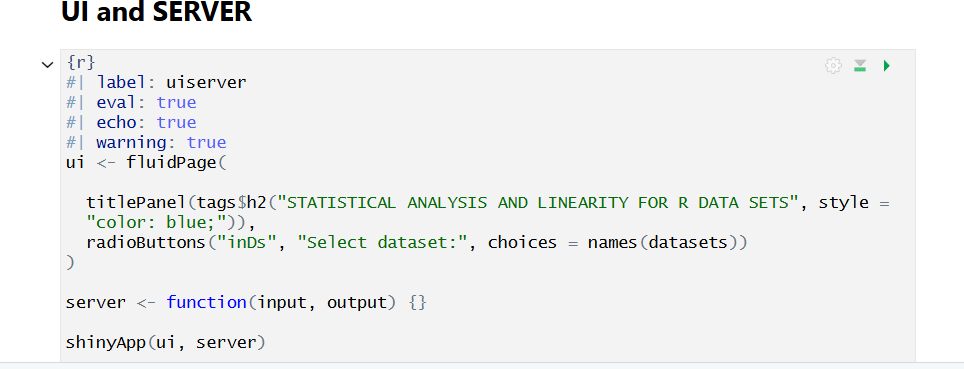
UI and SERVER
{r}
#| label: uiserver
#| echo: true
#| eval: true
ui <- fluidPage(
titlePanel(tags$h2("STATISTICAL ANALYSIS AND LINEARITY FOR R DATA SETS", style = "color: blue;")),
radioButtons("inDs", "Select dataset:", choices = names(datasets))
)
You need this in the header:
format: revealjs
server: shiny
And then in a slide you can use:
### slide title

```{r}
textInput("name", "What is your name?")
textOutput("name_out")
````

```{r}
#| context: server
output$name_out <- renderText(paste0("My name is ", input$name))
```
1 Like
When i use server: shiny instead of filter, I get the error below.
ERROR: Unknown option "--presentation". Did you mean option "--profile"?
1 Like
I'm not sure. Can you share your whole header?
1 Like
This is the presentation program so far.
title: "Linear Regression"
format: revealjs
editor: visual
filter: shiny
Introduction
This is a presentation that reads data files and runs an statistical summary and displays a plot to determine the linearity of data in the file. The data files are obtained from the R package "datasets" using the command: output dat<−renderPritdata(package="datasets") results[ , "Item"]) and manually stored in the variable "datasets".
The user selects a data file from an interactive menu first, and subsequently selects the variables in the data file to run the statistics and the regression on the selected data.
{r}
#| label: libraries
#| echo: true
#| eval:  true
suppressWarnings(suppressMessages(library(shinylive)))
suppressWarnings(suppressMessages(library(shiny)))
suppressMessages(suppressWarnings(library(rmarkdown)))
suppressMessages(suppressWarnings(library(dplyr)))
suppressMessages(suppressWarnings(library(bslib)))
{r}
#| label: datasets
#| echo: true
#| eval:  true
datasets <- list(Formaldehyde = Formaldehyde, Indometh = Indometh,
                 LifeCycleSavings = LifeCycleSavings, OrchardSprays = OrchardSprays,  Theoph = Theoph,                          chickwts = chickwts,faithful = faithful,                           randu = randu,ChickWeight = ChickWeight, Loblolly = Loblolly,                       anscombe = anscombe, beaver1 = beaver1, nottem = nottem,
                 stackloss = stackloss, swiss = swiss, DNase = DNase,
                 Nile = Nile, mtcars = mtcars, trees = trees)
{r}
#| label: uiserver
#| echo: true
#| eval:  true
ui <- fluidPage(

  titlePanel(tags$h2("STATISTICAL ANALYSIS AND LINEARITY FOR R DATA SETS", style =    "color: blue;")),
  radioButtons("inDs", "Select dataset:", choices = names(datasets))
)
1 Like
- List ite
m
I do not know if you can access the image, but if you do I found playing with shiny that the right hand side triangle display the shiny GUI correctly. When you click on the lefthandside icon to the left of the green triangle and you select "produce messages", when I run the presentation by rendering, I get the message:
Shiny applications not supported in static R Markdown documents
Can any thing be done to run the application in the presentation?
1 Like
I found this on a posit community post.
"Did you try publishing the presentation (like in quarto.pub) and then include in your shiny app using an Iframe?"
How would you do that? Since my shiny code executes outside of the presentation when I click the green arrow on the editor, may be, I have to do the above.
1 Like
The issue with your code is that you don't need to call shinyApp or out the server and ui code inside functions - as in the example I gave you just put the UI in a chunk and the server in another chunk that is flagged with #| context: server.
You can also put apps in an iframe - that's a much better solution if your app is complex. Just use this (the URL can be to an app running locally too):
<iframe width="1000" height="400" src="https://bootswatch.com/" title="Bootswatch"></iframe>
1 Like
Could you please check this script for me? The GUI is displayed, but upon data set selection from the radio buttons list, 2 drop down mmenus are dislpaying listing the selected data set variables. The problem is that the drop down menus do not updates the variables when a different data set is selected.
---
title: "Linear Regression"
format: revealjs
editor: visual
profile: shiny
smaller: true
scrollable: true
---

scrollable: true
---


Introduction
This is a presentation that reads data files and runs an statistical summary and displays a plot to determine the linearity of data in the file. The data files are obtained from the R package "datasets" using the command: output dat<−renderPrint(data(package="datasets")
 results[ , "Item"]) and manually stored in the variable "datasets".

The user selects a data file from an interactive menu first, and subsequently selects the variables in the data file to run the statistics and the regression on the selected data.

{r}
#| label: libraries
#| echo: true
suppressWarnings(suppressMessages(library(shinylive)))
suppressWarnings(suppressMessages(library(shiny)))
suppressMessages(suppressWarnings(library(rmarkdown)))
suppressMessages(suppressWarnings(library(dplyr)))
suppressMessages(suppressWarnings(library(bslib)))

{r}
#| label: data
#| echo: true
#| message: true
#| warning: true

datasets <- list(Formaldehyde = Formaldehyde, Indometh = Indometh,
                 LifeCycleSavings = LifeCycleSavings, OrchardSprays = OrchardSprays,                  Theoph = Theoph, chickwts = chickwts,faithful = faithful,                           randu = randu,ChickWeight = ChickWeight, Loblolly = Loblolly,                       anscombe = anscombe, beaver1 = beaver1, nottem = nottem,
                 stackloss = stackloss, swiss = swiss, DNase = DNase,
                 Nile = Nile, mtcars = mtcars, trees = trees)


{r}
#| label: selectinput
#| echo: true
#| message: true
#| warning: true

 titlePanel(tags$h2("DATA SETS", style =    "color: blue;"))
 radioButtons("inDs", "Select dataset:", choices = names(datasets))
observe(updateVarSelectInput(session, "inVar1", data = ds()))

{r}
#|context: server
ds <- reactive( datasets[[input$inDs]] )

{r}
varSelectInput("inVar", "Select variable:", datasets[[1]])
varSelectInput("inVar1", "Select a second variable:", datasets[[1]])

{r}
#|context: server
observe(updateVarSelectInput(session, "inVar", data = ds()))
observe(updateVarSelectInput(session, "inVar1", data = ds()))
1 Like
This topic was automatically closed 90 days after the last reply. New replies are no longer allowed.
If you have a query related to it or one of the replies, start a new topic and refer back with a link.