mtcars <- mtcars

p <- ggplot(mtcars, aes(x=disp)) + geom_density()
ggplotly(p)
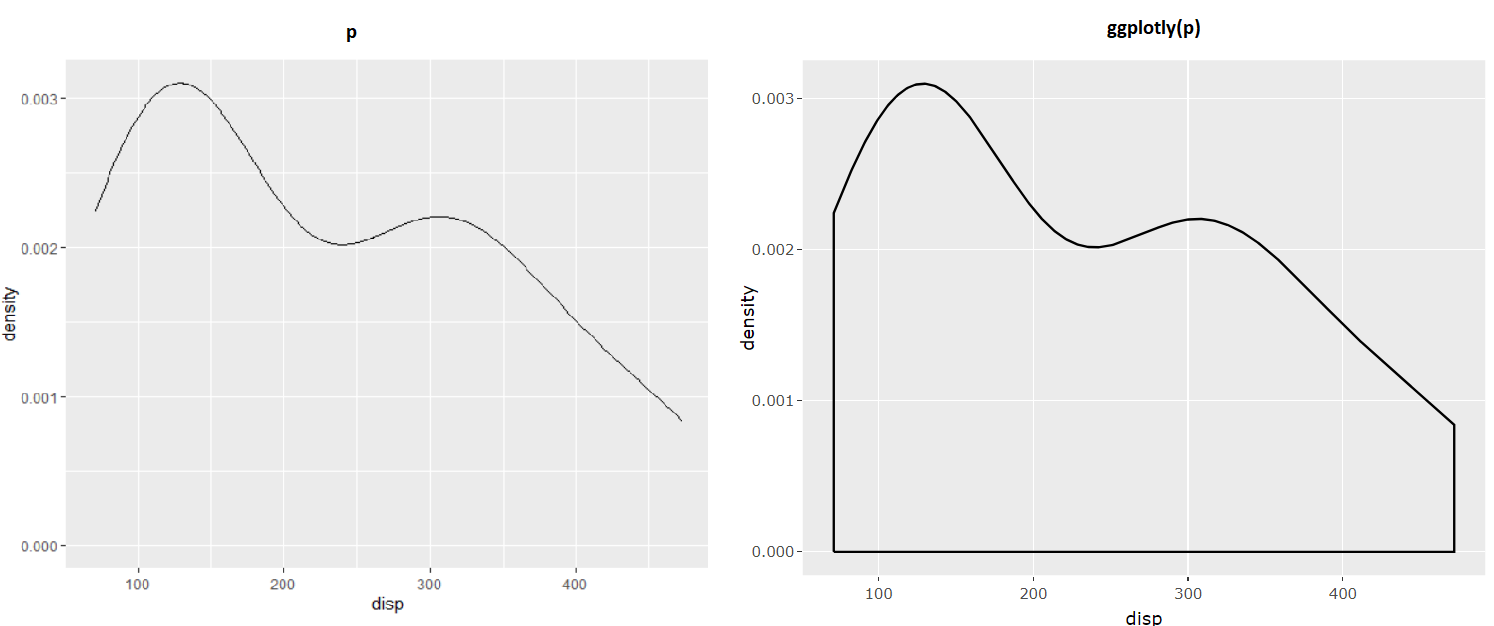
ggplot2::geom_density() used to include the outline, but removed it during this release:
Changelog • ggplot2 (tidyverse.org)
I don't know how frequently the ggplotly implementation tracks changes.
This topic was automatically closed 21 days after the last reply. New replies are no longer allowed.
If you have a query related to it or one of the replies, start a new topic and refer back with a link.