Hello everyone,
I'm working on my ggplots that look a little weird. The idea was to plot the lines and the confidence interval of each model, but something is not quite alright, I think. At least the plots for some groups look weird. On the other hand, I have other groups that look just fine plotted. But maybe someone can tell me either what the problem is and/or how I can fix it. I have little to no clue what I'm doing so the thing with the confidence intervals is just a wild guess on my end haha.
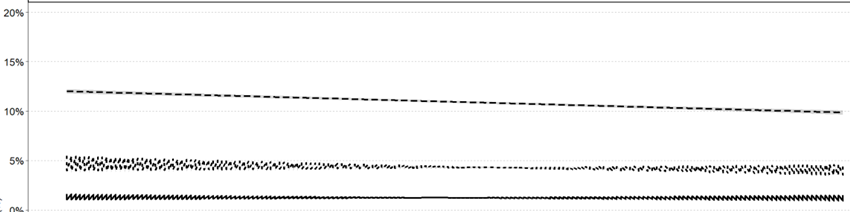
I'll try to show you an example and the code.
ggplot(data, aes(x = year.fr5, y = fit, ymin = lower, ymax = upper, linetype = outcome)) +
geom_ribbon(alpha = 0.2) +
geom_line(linewidth = 1.2,key_glyph = "path")
This part seems to be the problem, so I left out the rest of the plot code. It just looks weird. My goal would be to have a line for the data and to have the CI plotted around it as sort of a shadow.
I'm thankful for every piece of advice and help!