I have a data with 27 variable (columns) and 125 samples (rows). I am trying to do some PCA anlaysis using this script:
library("FactoMineR")
library("factoextra")
library(ggplot2)
mydata<- read.csv("Overall.csv", TRUE, ",")
mydata[is.na(mydata)]=0
attach(mydata)
X=cbind (Adj..1_12, Adj..1_13, Adj..1_2, Adj..10_11, Adj..11_12, Adj..12_13, Adj..2_11, Adj..2_12, Adj..2_13,
Adj..2_3, Adj..3_11, Adj..3_12, Adj..3_4, Adj..4_11, Adj..4_5, Adj..5_10, Adj..5_11, Adj..5_6,
Adj..6_10, Adj..6_11, Adj..6_7, Adj..6_9, Adj..7_10, Adj..7_8, Adj..7_9, Adj..8_9, Adj..9_10)
summary(X)
cor(X)
res.pca <- princomp(X, scores=TRUE, cor=TRUE)
summary(res.pca)
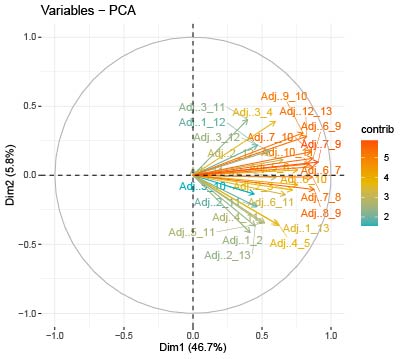
fviz_pca_var(res.pca, col.var="contrib",
gradient.cols = c("#00AFBB", "#E7B800", "#FC4E07"),
repel = TRUE, # Avoid text overlapping
axes = c(1, 2) # choose PCs to plot
)
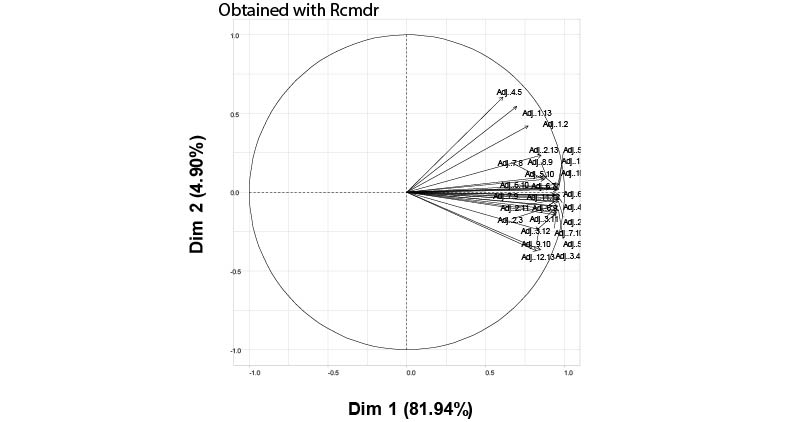
But I get different results from the one provided by Rcmdr and SPSS!!! The first (PC1) and second (PC2) principal components explained up to 81.94% and 4.9% respectively by the PCA analysis done with SPSS and Rcmdr package. Whereas using the above-given script provided a PCA plot, which explained up to 46.7% and 5.8% of the data!! Could it be due to a higher number of samples (125 rows)??
But the same script correctly estimates the PCA for other data (with fewer rows number) similar to the one provided by SPSS. Where is the mistake??
Many thank
Best regards,
Umar