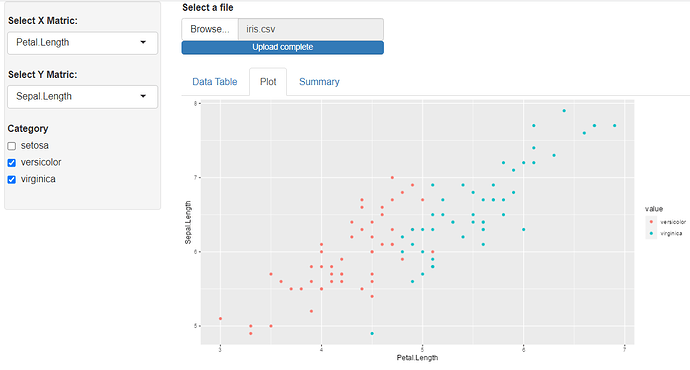
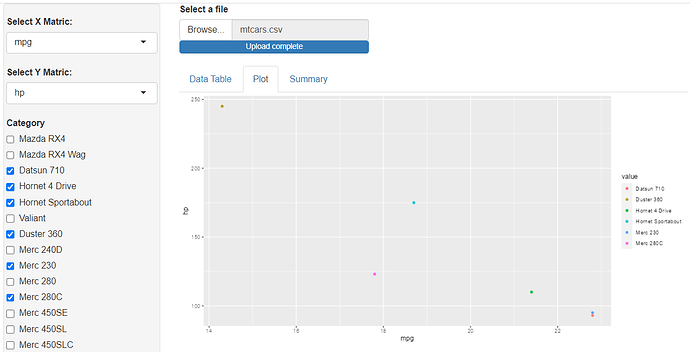
Hello , am a beginner in R especially in shiny. Am working on a simple Shiny app that allows you to select any csv file from your machine, shows you the table format of the dataset and allows you to plot a simple correlation using ggplot.
The problem am facing now is i want to create a filter function or any function to take the categorical values from the dataset, e.g in the iris dataset, the Specie names and use it to plot the points for that category on my ggplot. When i click the CHECKBOX for that category it should plot or remove the values on the ggplot. I want to make it general so it can work for any dataset, that's my problem.
Here is the code
 library(shiny)
library(shinydashboard)
library(tidyverse)
library(DT)
library(highcharter)
library(eply)
library(broom)
library(plotly)

shinyServer(function(input, output) {

  options(shiny.maxRequestSize = 30*1024^4)

   data = reactive({

     file <- input$Files
     if( is.null (file) ){ return() }
      else { read.csv (file =  file$datapath) }

   })

   output$data_table = renderDataTable({ data() })

   output$plot_graph = renderMenu({

     if( is.null( data() ) ){return()}
     else{
             numeric_df = as.data.frame(data()) [ sapply (as.data.frame(data()), is.numeric)]
             species =  as.vector( unique (as.data.frame(data()) [!sapply (as.data.frame(data()), is.numeric)]))
               species =  as.vector(unlist(species))


          sidebarMenu(
                       menuItem( text = "Linear Model",
                                 icon = icon("th"),
                                 selectInput( inputId = "xvalue",
                                              label = "Select X Matric:",
                                              choices = names(numeric_df),
                                              selected = names(numeric_df)[1]),

                                 selectInput( inputId = "yvalue",
                                              label = "Select Y Matric:",
                                              choices = names(numeric_df),
                                              selected = names(numeric_df)[2]),

                                 checkboxGroupInput( inputId = "CheckB",
                                  label = "Category",
                                  choices = species )

                             )
                  )
     }

   })

   output$scatter_plot = renderPlot({

      plotting_df = species %>% filter( species %in% as.vector( input$CheckB))
        col = unquote(names(data() [!sapply (data(), is.numeric)]))
        ggplot(data = plotting_df, aes_string( x=input$xvalue, y=input$yvalue, color = col)) +
        geom_point()

        })

   output$summary <- renderPrint({

     summary(data())
   })

   output$main_grid = renderUI({

     tabsetPanel( tabPanel( "Data Table",dataTableOutput("data_table")),
                   tabPanel("Plot", plotOutput("scatter_plot")),
                   tabPanel("Summary", verbatimTextOutput("summary")))

   })

})
The plotting_df is where am trying to write a code that can work generally for any dataset on the ggplot.
Please Help !!

