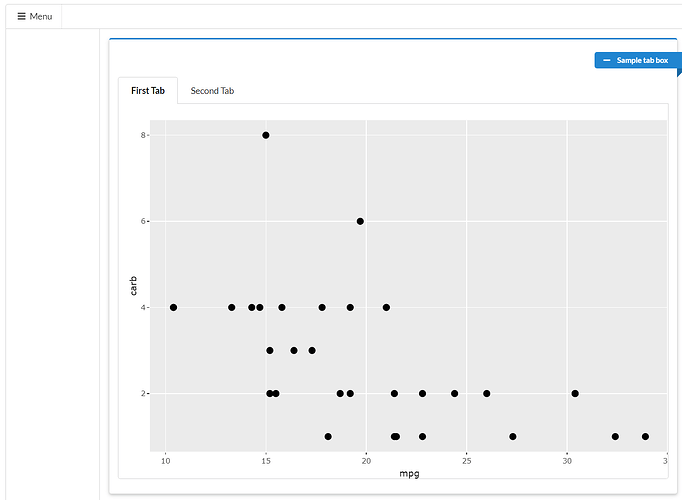
EDIT: Solved - the solution was to modify the box height using it's ID, and the plot height (using it's ID - not by ggplotly(p, height=... both inside the Custom CSS section. Code in comments.
Below is a minimal reprex for a simple Shiny app that has a plot. I want to:
- Increase the height of the box
- Increase the height of the plot within the box (to the same height as the box)
- Have the increase work across different window sizes
I've played around with a lot of things, but I cannot find a solution that satisfies these requirements. Do I modify height= in ggplotly? Do I include CSS that tries to adjust viewport height vh of the plot?
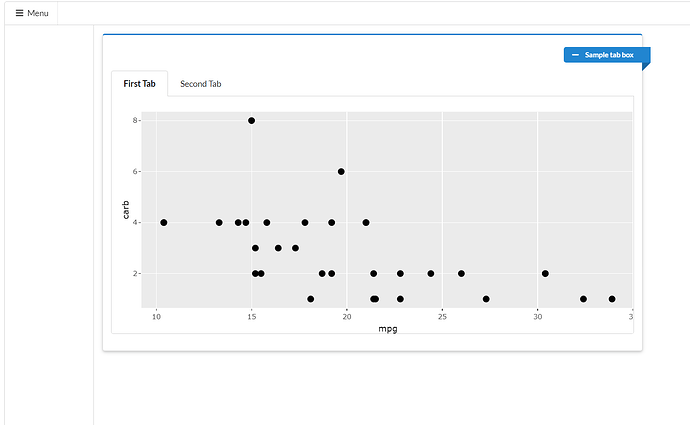
Default view:
library(shiny)
library(semantic.dashboard)
library(ggplot2)
library(plotly)
ui <- dashboardPage(
  dashboardHeader(),
  dashboardSidebar(sidebarMenu()),
  dashboardBody(

    #Create tab box
    tabBox(id="my_tab_box",
           title = "Sample tab box",
           color = "blue",
           width = 8,
           tabs = list(
             list(menu = "First Tab", content = plotlyOutput("myplot")),
             list(menu = "Second Tab", content = "This is second tab")))))

server <- function(input, output) {

  output$myplot <- renderPlotly({
    p <- ggplot(mtcars, aes(x=mpg, y=carb)) +
      geom_point(size=2.5)

    ggplotly(p)   })}

shinyApp(ui, server)
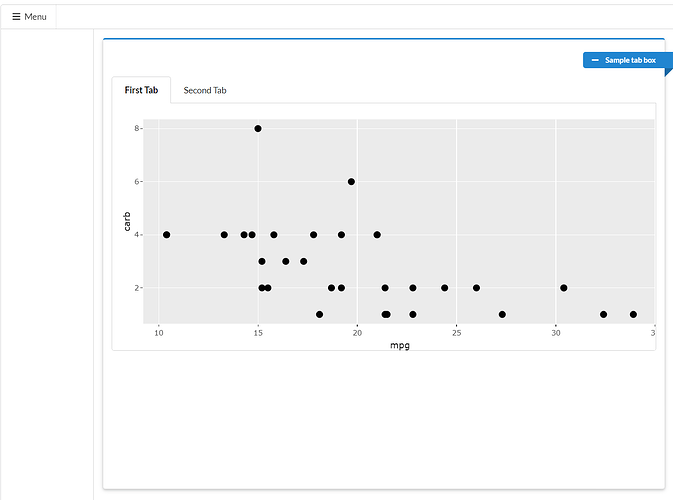
Increasing the box height doesn't increase plot height:
library(shiny)
library(semantic.dashboard)
library(ggplot2)
library(plotly)
ui <- dashboardPage(
  dashboardHeader(),
  dashboardSidebar(sidebarMenu()),
  dashboardBody(

    #Custom CSS
    tags$head(tags$style("#my_tab_box{height:700px !important;}")),


    #Create tab box
    tabBox(id="my_tab_box",
           title = "Sample tab box",
           color = "blue",
           width = 8,
           tabs = list(
             list(menu = "First Tab", content = plotlyOutput("myplot")),
             list(menu = "Second Tab", content = "This is second tab")))))

server <- function(input, output) {

  output$myplot <- renderPlotly({
    p <- ggplot(mtcars, aes(x=mpg, y=carb)) +
      geom_point(size=2.5)

    ggplotly(p)   })}

shinyApp(ui, server)


