Kjnmy
April 18, 2023, 7:57am
1
Dear friends:
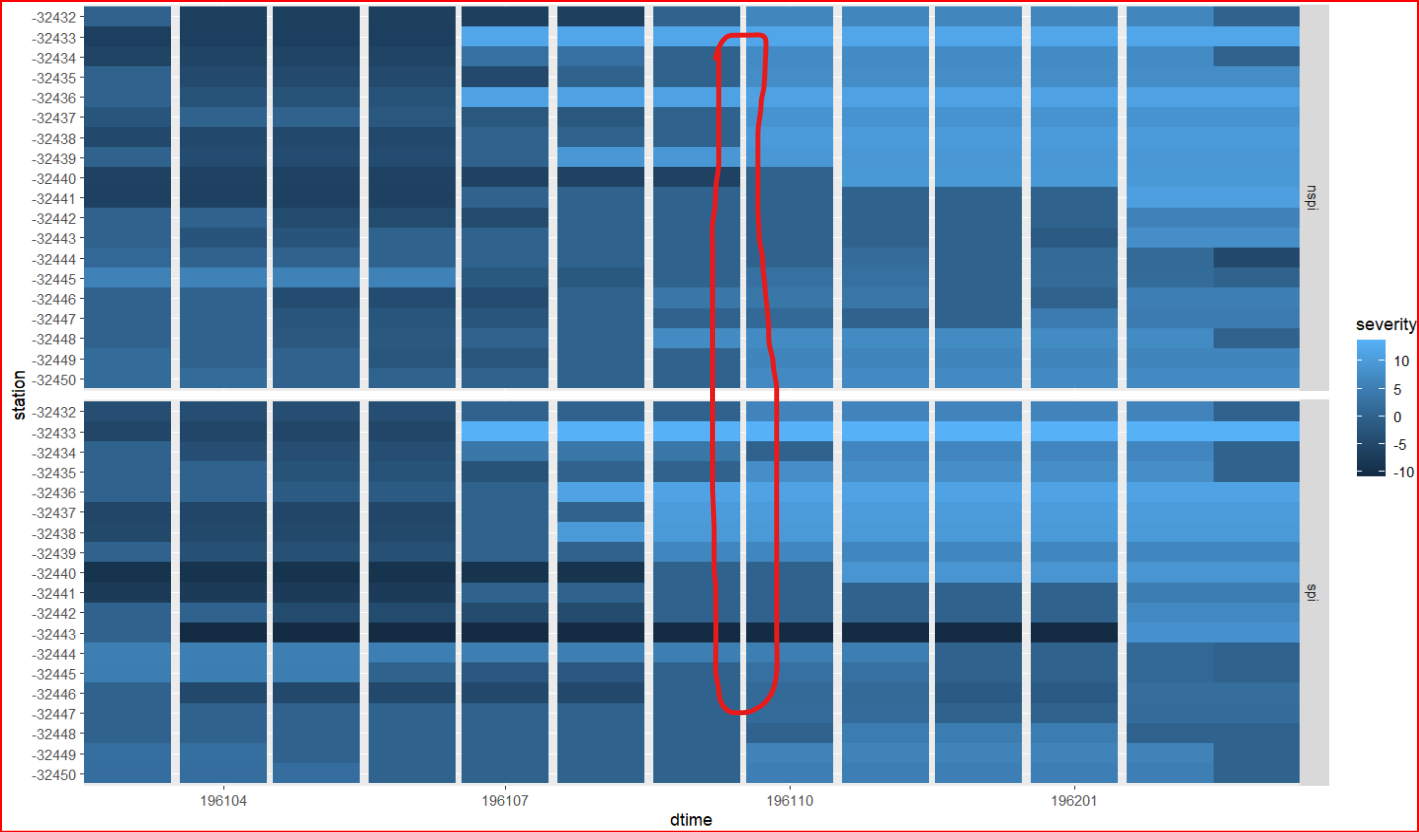
plotda <- xd[dtime<=as.Date('1962-3-1'),]
ggplot(plotda,aes(x=dtime,y=station,fill=severity))+
  geom_tile()+
  facet_grid(group~. )+
  scale_x_date(expand=expansion(mult=0,add=0),minor_breaks=NULL,date_labels='%Y%m')
I'd try changing panel spacing to zero by adding
+ theme(panel.spacing = unit(0,"cm"))
Kjnmy
April 18, 2023, 8:27am
3
Thank you very much for your answer, but multiple vertical gaps still exist.
for further assitance please provide a reprex
A minimal reproducible example consists of the following items:
A minimal dataset, necessary to reproduce the issue
The minimal runnable code necessary to reproduce the issue, which can be run
on the given dataset, and including the necessary information on the used packages.
Let's quickly go over each one of these with examples: