Why anim_save() change the ggplot axis and legend?

Hi community,

Im want to make a gganimate plot, but when use anim_save() the plot make in ggplot2 was change in x axis and legend.

library(tidyverse)
library(gganimate)
library(lubridate)

url <- "https://raw.githubusercontent.com/Aria-Dolatabadian/Dynamic-line-chart/main/temperature_data.csv"
temperature_data<- read_csv(url)

# Convertir la columna 'Day' a formato de fecha
temperature_data$Day <- as.Date(temperature_data$Day, format='%j')
temperature_data <- temperature_data %>%
  mutate(Day = ymd(Day)) %>%
  arrange(Day) %>%
  select(Day, Region1, Region2)

# Crear el gráfico base
p <- ggplot(temperature_data, aes(x = Day)) +
  geom_line(aes(y = Region1, color = 'Region 1'), size = 1) +
  geom_line(aes(y = Region2, color = 'Region 2'), size = 1) +
  scale_color_manual(name = "Regions", values = c("Region 1" = "blue", "Region 2" = "red")) +
  labs(x = "Day", y = "Temperature (°C)", title = "Daily Temperature Changes in Two Regions") +
  theme_minimal()

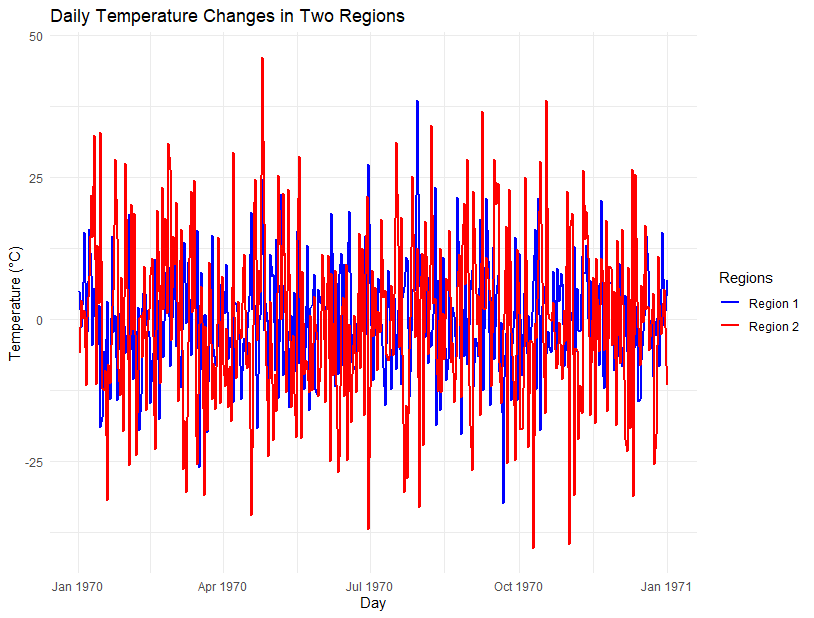
But when use anim_save() show this:

# Animar el gráfico
p_animated <- p +
  transition_reveal(Day) +
  ease_aes('linear')

# Guardar la animación como un archivo GIF
anim_save("Temperature_Changes_Animation.gif", p_animated)

Temperature_Changes_Animation

The x axis and legend are different.

Hi @M_AcostaCH. Does it show if you force the x-axis limits by adding the following?

scale_x_date(limits = c(min(temperature_data$Day), max(temperature_data$Day)))

Hi @scottyd22 , Im add this but nothing change.

I tried to reproduce your issue;

I found it wouldnt run without setting origin on as.Date.
but after doing so the remaining code ran and produced a correct animation.

Temperature_Changes_Animation

I find it suspicious that the origin was left for me to add, I wonder whether its a sign your r session was simply in a poor state, and if your restarted clean/empty if you would have the same result.

Ok. I actually got your code to work as written (without my suggestion). I'm using ggplot2 3.4.4 and gganimate 1.0.8.

Temperature_Changes_Animation

Hi @nirgrahamuk , my packages version are:

> packageVersion("ggplot2")
[1] ‘3.4.4.9000’
> packageVersion("gganimate")
[1] ‘1.0.8.9000’

:thinking:

Im install gganimate in this way:

# https://github.com/thomasp85/gganimate
# install.packages('pak')
pak::pak('thomasp85/gganimate')

This topic was automatically closed 21 days after the last reply. New replies are no longer allowed.

If you have a query related to it or one of the replies, start a new topic and refer back with a link.