Hello!
This summer, I'm working on building a shiny app for the gfpop package.
A big part of the application should consist of two linked plots.
I'm having trouble choosing a good approach to creating one of those plots, so I'm posting here hoping for some wisdom/help/advice!
Problem statement
I'm trying to make an interactive plot of a directed graph. Nodes just have labels, but edges contain quite a bit of information (1 string and 6 numeric values).
Here's an example of a static version of that graph:
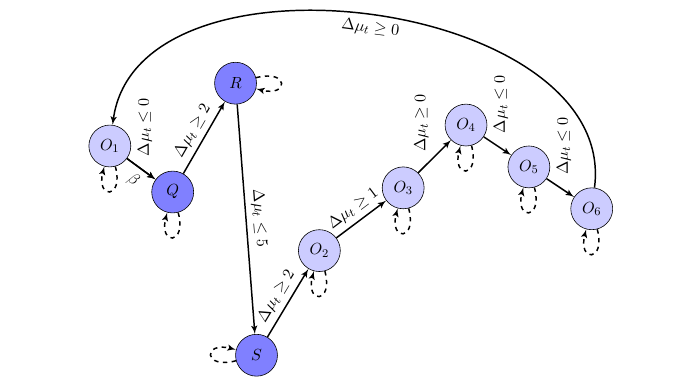
(And each edge has additional, not-shown parameters. Source: [2002.03646] gfpop: an R Package for Univariate Graph-Constrained Change-Point Detection)
The kicker is that the plot needs to have two big features:
- It should be entirely editable. So, users can add new nodes and new edges and edit existing nodes/edges. After the user edits the graph, they can click a button and re-run the main analysis.
- It should have crosstalk/linked brushing with the other plot.
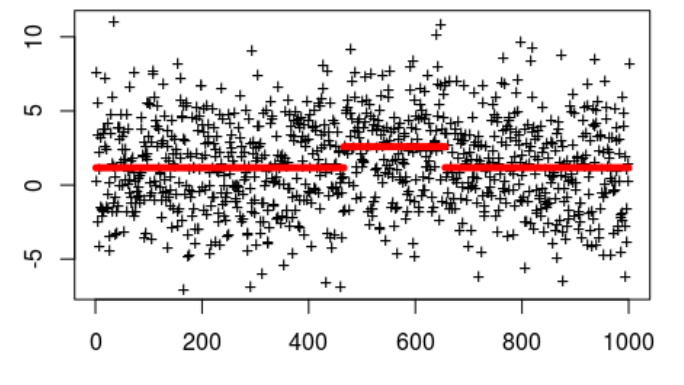
a. The other plot is just a scatterplot with overlain bars. Each bar corresponds to one of the nodes in the directed graph. I'll almost certainly make this with plotly. Looks like this:
 .
.
Each red bar corresponds to a node/edge. So, hovering over one of those red bars should highlight the corresponding node/edge.
I haven't found any framework that supports both of these features, but here's what I've considered:
Considered solutions
(More info in this issue in my repo)
- visNetwork
This is probably the most reasonable solution right now. But there are a couple of barriers. One is that the package doesn't, by default, allow for edges to have big lists of parameters--that may be reasonably fixed, so I submitted an issue. The other is that I don't think there's any way to link a visNetwork plot with the plotly plot since it doesn't support crosstalk.
- plotly
Using plotly would be fantastic since it can crosstalk with my other plotly visualization really easily. And shinyDAG seems to have successfully produced an editable directed graph with plotly, but it doesn't seem nearly as seamless and straightforward as visNetwork. But, it would be really great if I’m wrong about that and it is doable!
- Base d3
I’ve also considered trying to write exactly what I need in D3, building on this example, but it would be great if there’s an easier solution/existing tool. But if there’s not, please let me know! ![]()