I am working on a clustering analysis where my data is a mix of bool and numeric. From research it looks like one should not do a simple kmeans with mixed data types since the extreme end of scaled data will make the bools of 1/0 dominate.
The general gist of what I found online was to use a gower difference matrix which I did using cluster::daisy(). But, nevertheless, both on my actual data set and on the diamonds example below, I get perfect separation in clusters based on the booleans. This must be 'wrong' since the goal of using a gower matrix was to be able to cluster on mixed data types to avoid this kind of problem. So I'm hoping someone can spot where I might have misunderstood or offer some pointers.
My Rmd script to reproduce:
knitr::opts_chunk$set(echo = TRUE)
pacman::p_load(tidyverse, cluster, dbscan)
Get a shortened version of diamonds with a mix of bool and numeric data.
my_diamonds <- diamonds |>
  sample_n(20000) |>
  mutate(
    is_premium = ifelse(cut == 'Premium', 1, 0),
    is_color_def = ifelse(color %in% c('D', 'E', 'F'), 1, 0)
    ) |>
  select(carat, is_premium, is_color_def, depth:x)
Create a gower difference matrix using cluster::daisy(). Specify the bool fields in type = list(symm = c('is_premium', 'is_color_def').
As I understand it, since I'm calculating a difference matrix I don't have to scale or transform the data,
# create a gower distance matrix since we have mixed data types (bool and numeric)
gower_dist <- daisy(my_diamonds, metric = "gower", stand = T, type = list(symm = c('is_premium', 'is_color_def')))
gower_dist |> summary()


199990000 dissimilarities, summarized :
   Min. 1st Qu.  Median    Mean 3rd Qu.    Max.
 0.0000  0.1143  0.1967  0.2042  0.2895  0.6926
Metric :  mixed ;  Types = I, S, S, I, I, I, I
Number of objects : 20000
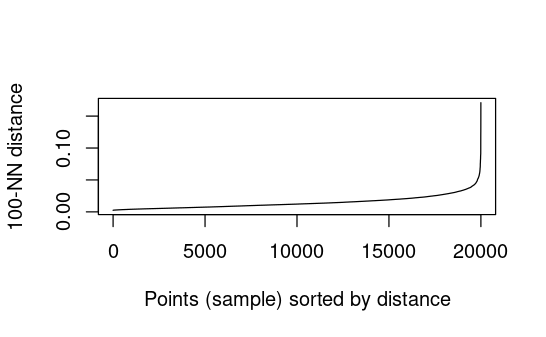
See if this plot helps choose values for eps in dbscan
# Determine optimal eps value to start with
dbscan::kNNdistplot(gower_dist, k = 100) # no idea what to put for K
  # no kink or 'knee'
Run dbscan() using the difference matrix.
# Perform DBSCAN clustering
dbscan_result <- dbscan(gower_dist, eps = 0.02, minPts = 10) # eps from median of summary(gower_dist)

# Get cluster labels
cluster_labels <- dbscan_result$cluster

# Get noise points (not assigned to any cluster)
noise_points <- which(cluster_labels == 0)

# Get number of clusters
num_clusters <- max(cluster_labels)

cat("Number of Clusters:", num_clusters, "\n")
cluster_labels |> table()

# Print the results
my_diamonds$cluster <- cluster_labels
my_diamonds %>%
  group_by(cluster) %>%
  summarize(count = n(), across(everything(), list(avg = ~ mean(., na.rm = TRUE)), .names = "{.col}_{.fn}")) %>%
  select(count, everything())
Results print out as:
Number of Clusters: 4
cluster_labels
   0    1    2    3    4
 197 7273 7530 2736 2264
And the data frame with average of each var per cluster. You can see that the bool vars highlighted are 1 or 0 indicating perfect separation:
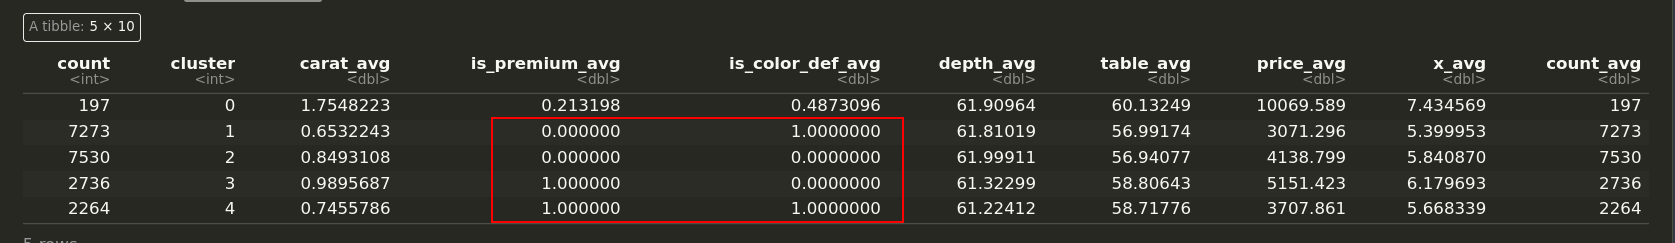
Have I misunderstood how to use daisy with mixed data types? Must I transform my difference matrix in someway?
How can I get around this perfect separation of clusters that the boolean vars create?
[edit]
I tried adding weights to the bools when I create the dissimilarity matrix like so:
weights <- c(1, 0.05, 0.05, 1,1,1,1) # bools weighted tiny now
gower_dist <- daisy(my_diamonds, metric = "gower", stand = T, weights = weights, type = list(symm = c('is_premium', 'is_color_def')))
But the issue persists, the bools cause perfect separation.