Hi Community
Im try to add more tabPanel in Shiny but when make this, appear in all other tabs.
I think that is problem with (). Im check many times but not find the error. I need put more tabs but each one different.
For example the tabs are: MANUAL DE USO, UBICACIÓN DE PLUVIÓMETROS, TABLA DE DATOS,GRAFICA GENERAL, GRAFICA REACTIVA.
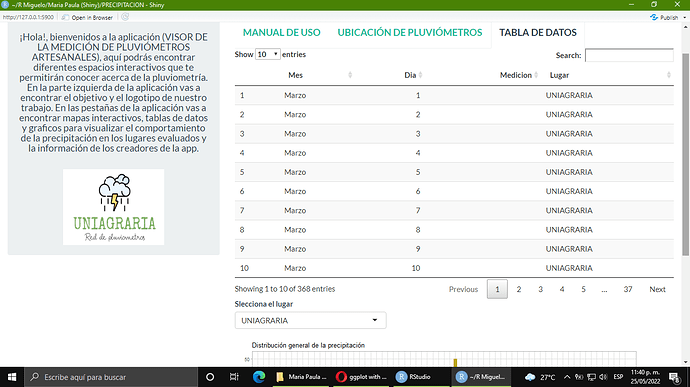
Show tabs type in all tabs. I need in different tabs.
link of data: meses2.xlsx - Google Sheets
Code
library(shiny)
library(leaflet)
library(rgdal)
library(shinyjs)
library(DT)
library(readxl)
library(tidyverse)
library(shinythemes)


setwd("~/R Miguelo/Maria Paula (Shiny)/PRECIPITACION")

Latitude <-c(4.75348056, 4.7510256,4.9632220, 4.907428)
Longitude <-c(-74.05319722,-74.0509063,-74.0705110,-74.098168)
ID<-c("Uniagraria","Granada Norte","Rio Frio","Chicu")
Dist <-c("Uniagraria","Granada Norte","Rio Frio","Chicu")
DF <-data.frame(Dist,Latitude,Longitude,ID)
loc <- unique(DF$Dist)

#Complete el codigo abajo para generar su app
#Definir UI

ui <- fluidPage(
      theme = shinytheme("flatly"),
      titlePanel("Red de pluviometros artesanales en el municipio de Tabio -Cundinamarca- y Bogotá DC"),

                sidebarLayout(
                  sidebarPanel(h4("¡Hola!, bienvenidos a la aplicación (VISOR DE LA MEDICIÓN DE PLUVIÓMETROS ARTESANALES), aquí podrás encontrar diferentes espacios interactivos que te permitirán conocer acerca de la pluviometría.

En la parte izquierda de la aplicación vas a encontrar el objetivo y el logotipo de nuestro trabajo. En las pestañas de la aplicación vas a encontrar mapas interactivos, tablas de datos y graficos para visualizar el comportamiento de la precipitación en los lugares evaluados y la información de los creadores de la app."),
                   br(),
                   img(src="slogan.png",
                       height =150, width=200),
                       align="center"),

                  mainPanel(
                    tabsetPanel(
                      tabPanel(h4(strong("MANUAL DE USO")),
                               h3(strong("Hola, bienvenidos a la aplicación (Visor de la medición de pluviómetros artesanales), aquí podrás encontrar diferentes espacios interactivos que te permitirán conocer acerca de la pluviometría.
En la parte izquierda de la aplicación vas a encontrar el objetivo y el logotipo de nuestro trabajo. Ahora dirígete a la segunda pestaña, allí vas a encontrar un mapa Leaflet y un widget, este te permitirá seleccionar cada una de las ubicaciones donde se encuentran los pluviómetros. Al seleccionar alguna de ellas te aparecerá una imagen sobre el pluviómetro y un popup del punto en específico.
En la tercera pestaña, vas a encontrar un widget, en el cual podrás seleccionar alguno de los puntos de medición. Al seleccionar alguno de estos puntos, se desplegará una tabla que contiene la medición de datos pluviométricos en el tiempo que se realizó el estudio.
En la cuarta pestaña, se podrán visualizar las gráficas que representan los datos de estas mediciones, mensual y diariamente en cada uno de los lugares de estudio. En esta pestaña encontraras de igual manera un widget para seleccionar la grafica que deseas ver.
Por último, en la quinta pestaña se encontrará información acerca de las creadoras de la aplicación, como sus datos personales y académicos.
"))),

                      tabPanel(h4(strong("UBICACIÓN DE PLUVIÓMETROS")),
                               mainPanel(
                                 selectInput("var",label="Seleccione la ubicacion que desea observar",
                                             choices=c("General","Chicu","Granada Norte","Rio Frio"                                                               ,"Uniagraria"),
                                             selected="General"),

                                 fluidRow(column(6,
                                          leafletOutput("mymap", height = 390,width = 390)),
                                          br(),
                                   imageOutput('a.image'),align="rigth",

                                 ))),

                      tabPanel(h4(strong("TABLA DE DATOS")),
                               DT::dataTableOutput("mytable"))),

                      tabPanel(h4(strong("GRAFICA GENERAL")),
                               selectInput(inputId = "sel_Lugar",
                                           label = "Slecciona el lugar",
                                           choices = precip$Lugar,
                                           "Names"),
                               plotOutput("plot")),

                    tabPanel(h4("Grafica"))
                  )))


#Define server logic
server<- function(input,output){

  mymap_proxy <- leafletProxy("mymap")

  filtered <- reactive({
    DF[DF$Dist == input$var,]
  })

  output$mytable = DT::renderDataTable({read_excel("C:\\Users\\MiguelAngel\\Documents\\R Miguelo\\Maria Paula (Shiny)\\meses2.xlsx",sheet="F")
  })

  output$mymap <- renderLeaflet({
    leaflet() %>% addTiles()
  })

  precip = read_excel(
    "C:\\Users\\MiguelAngel\\Documents\\R Miguelo\\Maria Paula (Shiny)\\meses2.xlsx",
    sheet="F")
  precip$Mes <- factor(precip$Mes, levels = c("Marzo", "Abril", "Mayo"))
  output$plot <- renderPlot({
    req(input$sel_Lugar)
    precip %>%
      filter(Lugar == input$sel_Lugar) %>%
      group_by(Lugar, Mes, Medicion, Dia) %>%
      summarise(precip = sum(Medicion, na.rm = TRUE)) %>%
      ggplot(aes(x = Dia, y = Medicion, fill = Mes)) +
      geom_col(position=position_dodge(), size=1.5) +
      scale_fill_manual(values=c("#E23D2C","#BAA512","#512B9A",
                                 "#21AB3F")) +
      scale_x_continuous(breaks=seq(0,31,by=1)) +
      labs(title = "Distribución general de la precipitación",
           caption= "Fuente: propia")+
      ylab("Precipitación (mm)") +
      theme_light()
  })

  observe({
    DF <- filtered()
    mymap_proxy %>%
      clearMarkers() %>%
      addMarkers(lng = DF$Longitude, lat = DF$Latitude, #popup=DF$ID,
                 popup = paste(DF$ID,br(), DF$lug,br(), DF$cod) ) %>%
      flyTo(lng = DF$Longitude, lat = DF$Latitude, zoom = 11)
  })


  output$a.image<- renderImage({
    image_file<- paste("www/",input$var,".png",sep="")
    return(list(src=image_file,
                filetype="image/png",height=175,
                width=175, align="right"))
  }, deleteFile = FALSE)


  output$mymap1<-renderLeaflet(

    leaflet() %>% addTiles(group="mymap1") %>%
      addMarkers(lng= -74.05319722, lat=4.75348056,popup="Uniagraria")%>%
      addMarkers(lng= -74.0509063, lat=4.7510256,popup="Granada Norte")%>%
      addMarkers(lng= -74.0705110, lat=4.9632220,popup="Rio Frio")%>%
      addMarkers(lng= -74.098168, lat=4.907428,popup="Chicu")


  )
  output$grafica1 <- renderPlot({
    if(input$Tablameses=="Primavera"){

    }


  })


}

#Run the app
shinyApp(ui=ui,server=server)
Data
precip <- structure(list(Mes = structure(c(2L, 2L, 2L, 2L, 2L, 2L, 2L,
2L, 2L, 2L, 2L, 2L, 2L, 1L, 1L, 1L, 1L, 1L, 1L, 1L, 1L, 1L, 1L,
1L, 1L, 1L, 1L, 1L, 1L, 1L, 1L, 1L, 1L, 1L, 1L, 1L, 1L, 1L, 2L,
2L, 2L, 2L, 2L, 2L, 2L, 2L, 2L, 2L, 2L, 3L, 3L, 3L, 3L, 3L, 3L,
3L, 3L, 3L, 3L, 3L), .Label = c("Marzo", "Abril", "Mayo"), class = "factor"),
    Dia = c(17, 18, 19, 20, 21, 22, 23, 24, 25, 26, 27, 28, 29,
    17, 18, 19, 29, 30, 31, 1, 2, 3, 4, 5, 6, 7, 8, 17, 18, 19,
    20, 21, 22, 23, 24, 25, 26, 27, 16, 17, 18, 19, 20, 21, 22,
    23, 24, 25, 26, 5, 6, 7, 8, 9, 10, 11, 12, 13, 14, 15), Medicion = c(50,
    17, 13, 12, 3, 6, 0.3, NA, 13, 1, 4, 20, 3, NA, 0, 0, 0,
    0, 20, NA, NA, NA, NA, NA, NA, NA, NA, NA, 1, 0, 0, 5, 9,
    0, 1, 0, 0, 0, 0, 2, 17, 58, 32, 0, 9, 0.5, 1, 25, 1, 0.5,
    4, 10, 3, 3, 8, 36, 13, 1, 0.5, 0.5), Lugar = c("UNIAGRARIA",
    "UNIAGRARIA", "UNIAGRARIA", "UNIAGRARIA", "UNIAGRARIA", "UNIAGRARIA",
    "UNIAGRARIA", "UNIAGRARIA", "UNIAGRARIA", "UNIAGRARIA", "UNIAGRARIA",
    "UNIAGRARIA", "UNIAGRARIA", "GRANADA NORTE", "GRANADA NORTE",
    "GRANADA NORTE", "GRANADA NORTE", "GRANADA NORTE", "GRANADA NORTE",
    "RIO FRIO", "RIO FRIO", "RIO FRIO", "RIO FRIO", "RIO FRIO",
    "RIO FRIO", "RIO FRIO", "RIO FRIO", "CHICU", "CHICU", "CHICU",
    "CHICU", "CHICU", "CHICU", "CHICU", "CHICU", "CHICU", "CHICU",
    "CHICU", "RIO FRIO", "RIO FRIO", "RIO FRIO", "RIO FRIO",
    "RIO FRIO", "RIO FRIO", "RIO FRIO", "RIO FRIO", "RIO FRIO",
    "RIO FRIO", "RIO FRIO", "GRANADA NORTE", "GRANADA NORTE",
    "GRANADA NORTE", "GRANADA NORTE", "GRANADA NORTE", "GRANADA NORTE",
    "GRANADA NORTE", "GRANADA NORTE", "GRANADA NORTE", "GRANADA NORTE",
    "GRANADA NORTE")), row.names = c(NA, -60L), class = c("tbl_df",
"tbl", "data.frame"))