Hi all,
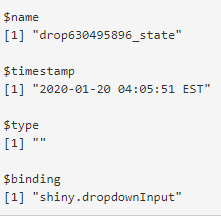
My intention here is to track how users uses my application. So for this, I have built sample application with tracking code incorporated (please refer below). Fortunately, I am able to save log files and fetch those data into R studio.
Right now, I am opening the application, playing around the data and then closing it. Post this I am opening this tracking information in R studio to understand how I have used my application.
But I am facing few problems. I am not sure about few terminologies here in the output like timestamp and all. My questions are below,
-
Does it give the order of my execution, like at time 't1', I have clicked on input 'I1' to get the output 'O1'. But I do not think so this application is tracking in that way. Could you please make me understand and correct me how to read the logs file.
-
Can we have a reference/unique id, So that I know for this ID, I have clicked on Input 'I1' to to get the output 'O1' at time 't1'
Below is my ui.R code
library(shinydashboard)
library(readxl)
library(shiny)
library(shinylogs)
out <- data.frame(baseFns = ls('package:base'))


#Save and naigate log files

if (interactive()) {
  tmp <- getwd()

  onStop(function(){
    browseURL(url = tmp)
  })
}

# Define UI for application that draws a histogram
use_tracking()

dashboardPage(
  dashboardHeader(title = "Loading data"),
  dashboardSidebar(sidebarMenu(
    menuItem("Load Data", tabName = "Load_Data", icon = icon("balance-scale")),
    menuItem("Analysis", tabName = "Analysis", icon = icon("chart-bar"))
  )),
  dashboardBody(
    tabItems(tabItem(tabName = "Load_Data", numericInput("T", "No of data sets", value = 1, min = 1, width = 150),
                     # textInput("T", "No of data sets", value = 0,width = 150),
                     fluidRow(tags$div(id = "container")),
                     fluidRow(tags$div(id = "remove")),
                     fluidRow(box(title = "Dataset",uiOutput("filter_70"),width = 5000)))
    ),verbatimTextOutput("last"))
)
Below is my server.R code
library(shiny)
library(shinylogs)
source("ui.R")

# Define server logic required to draw a histogram
shinyServer(function(input, output) {

  track_usage(
    storage_mode = store_json(path = tmp)
  )

  observe({
    req(input$T)
    removeUI("#fileInputContainer")
    removeUI("#remove1")
    insertUI("#container", "afterBegin", tags$div(id = "fileInputContainer"))
    insertUI("#remove", "afterBegin", tags$div(id = "remove1"))
    for(i in 1:input$T) {
      insertUI("#fileInputContainer", "beforeEnd",
               box(fileInput(paste0("dataFile", i), "Choose the csv file",
                             accept = c("text/csv","text/comma-separated-values,text/plain",".csv")),width = 2,height = 100))
    }
    for(i in 1:input$T) {
      insertUI("#remove1", "beforeEnd",
               box(actionButton("remove","remove",width = 140),width = 2))
    }
  })
  observeEvent(input$remove,{
    removeUI(selector = "#dataFile",immediate = TRUE)
  })

  output$contents <- renderTable({
    file_to_read <- input$dataFile
    if(is.null(file_to_read))
      return(NULL)
    a <- read.csv(file_to_read$datapath)
    head(a,n=15)
  })

  last_selected <- reactiveVal(NA)

  observeEvent(input$dataFile, {
    last_selected("csv")
  })

  output$filter_70 <- renderUI({
    req(last_selected())
    if (last_selected()=="csv") {
      tableOutput("contents")
    }
  })

  output$last <- renderPrint({
    input$.shinylogs_lastInput
  })

})
