Problem
Capture the javascript changes to plot made with DiagrammeR into word.
Current Attempt
Try to use webshot to take first render image in an html and capture a screenshot of the image as a png .
- Run the markdown code below.
- Run webshot with delay to try and allow javascript to process, but it looks like it is not triggered.
webshot::webshot("ex.html", delay = 0.2)
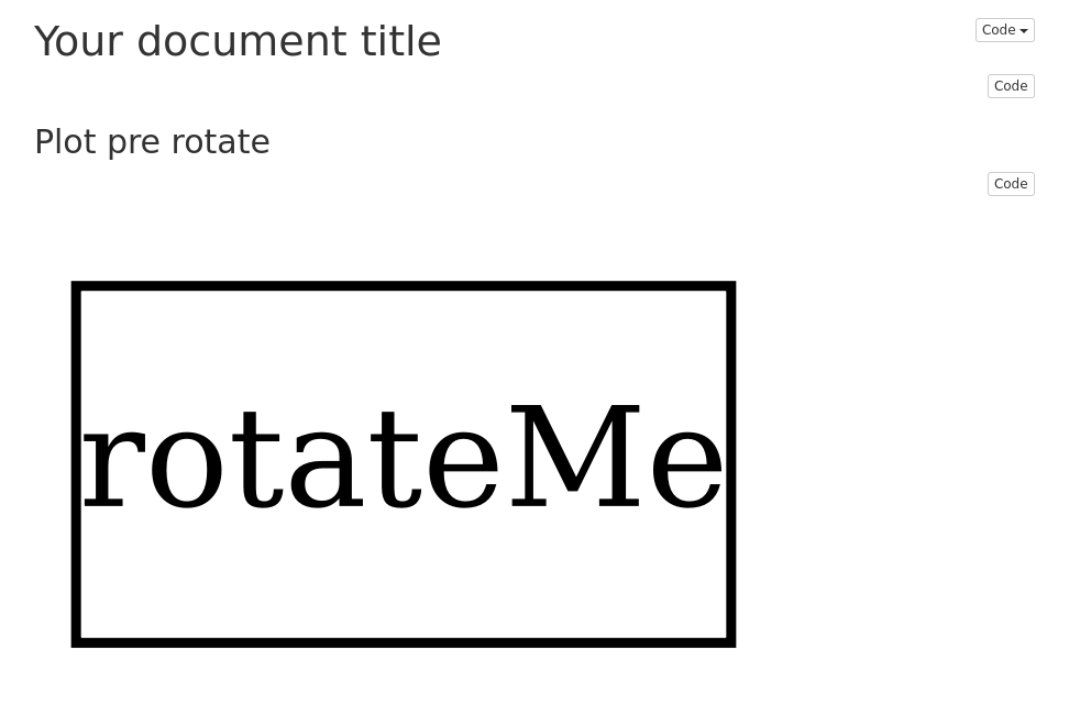
This always captures the image before the javascript renders.
Background
I am automating a report and when the output is html it works fine, but when its word I'd like to capture and insert a png from the html. I am using DiagrammeR to create some vertical text, but since this is not supported directly in the package I'm using some code I found in PRISMA2020 that rotates the text using javascript. This works great for HTML, but when I want to render a report in word this can't be captured.
I had the thought to screenshot the image using webshot, but it doesn't capture the javascript changes.
Anyone know how to get webshot to reflect the javascript changes of a local html file?
Image when opening HTML
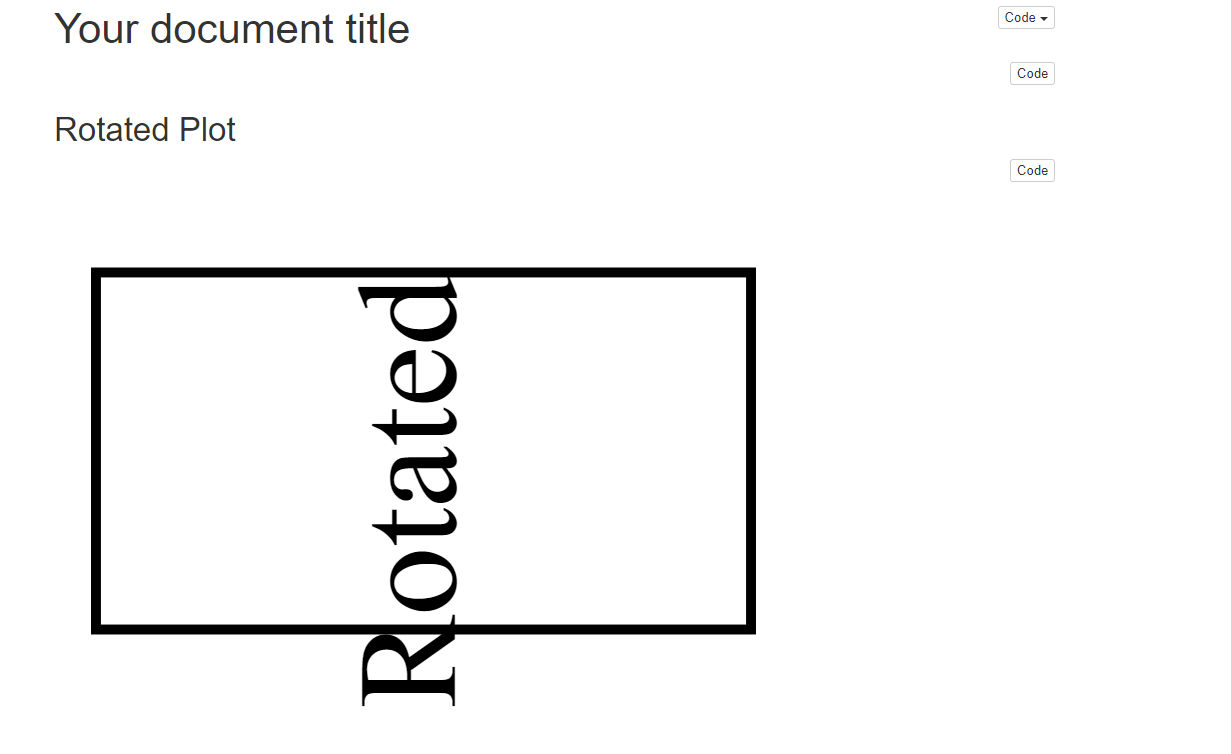
Image in webshot
RMD
Note that all blocks end with #``` below.
---
title: "Your document title"
author: ""
output:
  html_document:
    code_folding: hide
---


```{r, include=FALSE}
knitr::opts_chunk$set(echo = TRUE)
library(dplyr)
#```

```{r}
formatBox <- sprintf(
"
node [shape = box]
")

boxes <-
"
identification[label= rotateMe]
"

str <-
  paste0("digraph prisma {graph[layout=neato]\n",
         formatBox,
         boxes,
         "\n}")


plot <-
  str %>%
  DiagrammeR::grViz()

text <- 'Rotated'

  javascript <- htmltools::HTML(paste0("\n
                                       const nodeMap = new Map([
                                       [\"node1\",\"",  text, "\"]]);\n
                                       for (const [node, label] of nodeMap){\n
                                       var theDiv = document.getElementById(node);\n
                                       var theText = theDiv.querySelector(\"text\");\n
                                       var attrX = theText.getAttribute(\"x\");\n
                                       var attrY = theText.getAttribute(\"y\");\n
                                       theText.setAttribute(\"y\",parseFloat(attrX))\n
                                       theText.setAttribute(\"x\",parseFloat(attrY)*-1)\n
                                       theText.setAttribute(\"style\",\"transform: rotate(-90deg);\")\n
                                       theText.setAttribute(\"dominant-baseline\", \"middle\")\n
                                       theText.innerHTML = label;\n
                                       }\n    "))

  plot <- htmlwidgets::appendContent(plot, htmlwidgets::onStaticRenderComplete(javascript))

#```

## Rotated Plot

```{r}
  plot


#```