webR TCX Demo
Authors: Bobby Sayers, Melissa Albino Hegeman
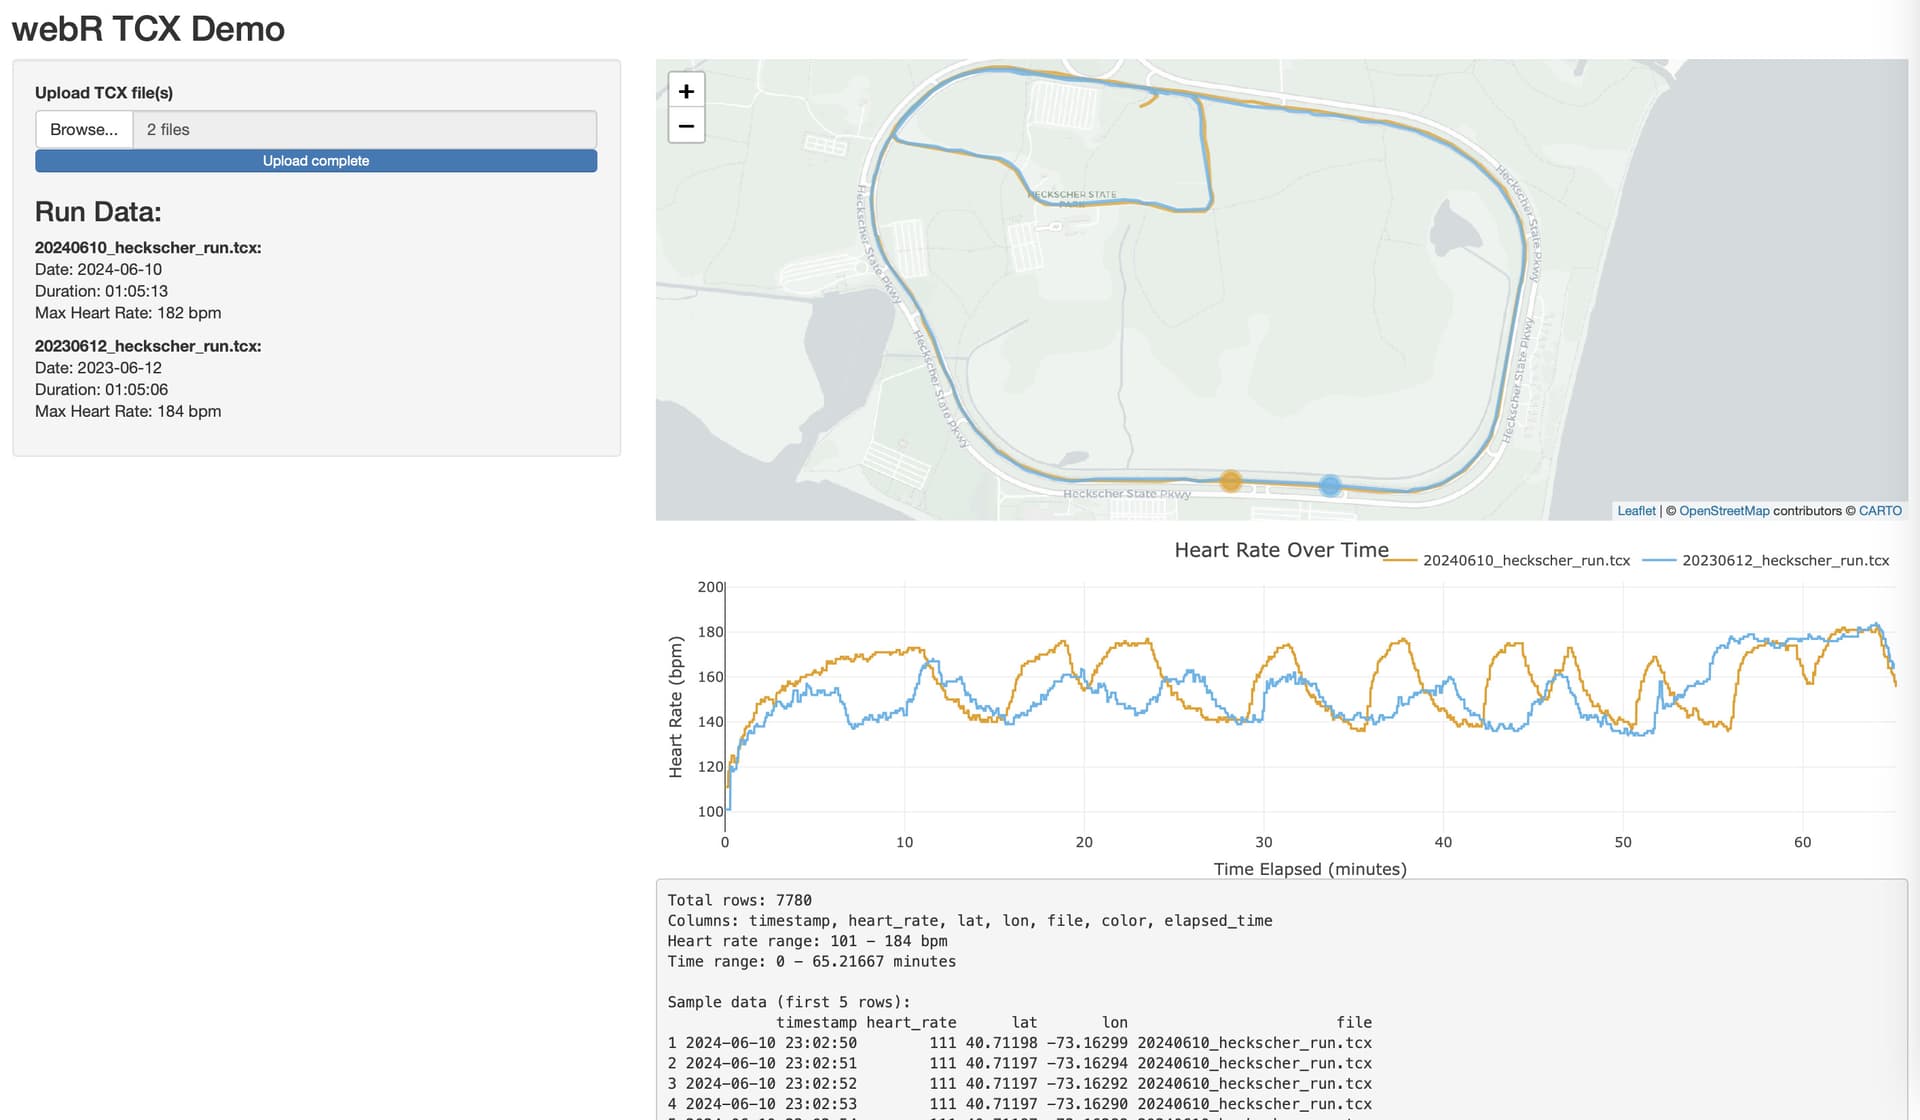
Abstract: TCX Data Viewer is a Shiny application that allows users to upload and visualize data from Training Center XML (TCX) files. This app is particularly useful for athletes and fitness enthusiasts who want to analyze their workout data, including GPS tracks and heart rate information.
Full Description: How to Use
Launch the application.
Use the file input in the sidebar to upload one or more TCX files.
The app will process the files and display:
A summary of each file's information in the sidebar
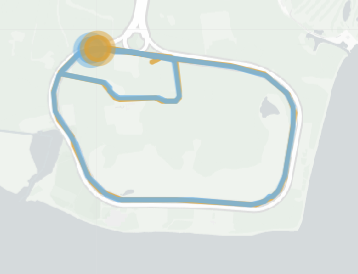
GPS tracks on the map in the main panel
An interactive heart rate plot for all activities in the main panel
Hover over the heart rate plot to see the corresponding location on the map.
Technical Details
This application is built using R and the following key libraries:
shiny: For creating the web application
leaflet: For rendering interactive maps
xml2: For parsing TCX files
lubridate: For handling date-time data
plotly: For creating the interactive heart rate plot
dplyr and tidyr: For data manipulation
The app uses a colorblind-friendly color-coding system to distinguish between multiple uploaded files on both the map and the heart rate plot.
Installation
To run this application locally:
Make sure you have R installed on your system.
Install the required packages:
install.packages(c("shiny", "leaflet", "xml2", "lubridate", "plotly", "dplyr", "tidyr"))
Save the provided R script as app.R.
Run the application in R:
shiny::runApp("path/to/app.R")
Notes
The application supports multiple file uploads, allowing for comparison between different activities.
Error handling is implemented to manage issues with file processing.
The map shows start and end points for each activity, along with the full GPS track.
The heart rate plot allows for easy comparison of heart rate data across multiple activities.
Hovering over the heart rate plot updates the map with the corresponding location, enabling interactive exploration of the data.
A debug output is available, showing details about the processed data.
Shiny app: Shiny App
Repo: GitHub - sayersr/2024_scgis_tcx_webr
Thumbnail:
Full image: