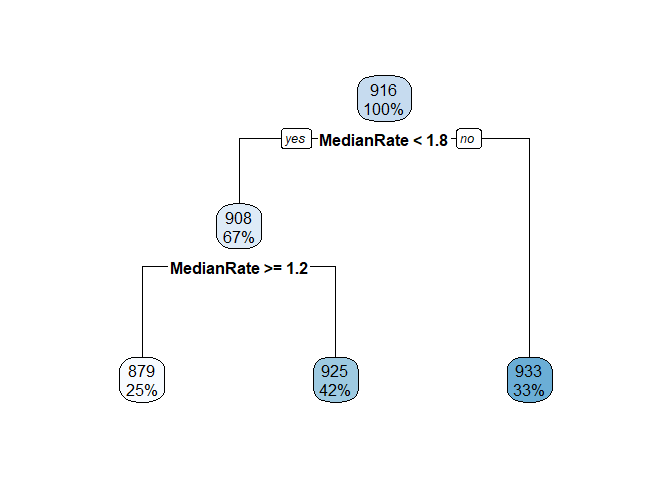
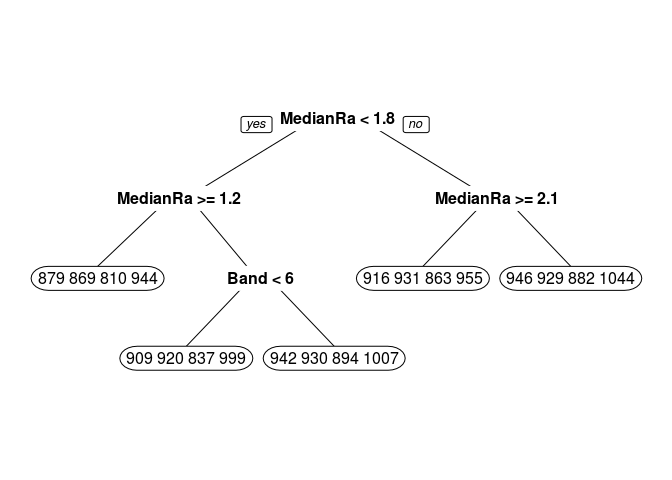
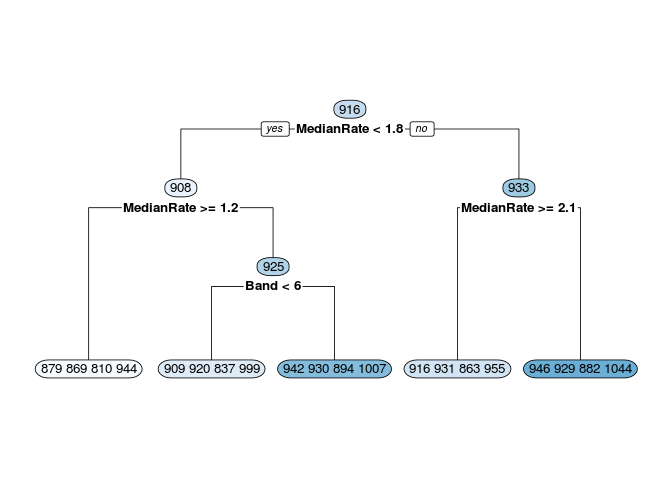
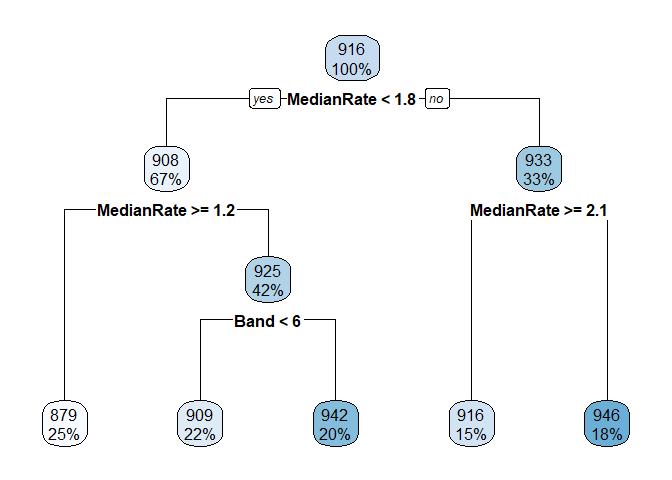
Below are some calculations on a data set I invented. Finding the mean, median, etc. of the leaf nodes is shown first. It is easy to match LeafStats$LeafNum to the rpart.plot by looking at the Mean values.
I started calculations for the other nodes and you can see that it is much uglier. From fit$splits I can get from the index column the exact value used to split each node. For example, the top node is split at MedianRate < 1.7635074. Competing splits that where not used are also shown in Splits, so you have to be careful. From the fit$frame element I can get the node numbers and the mean y values of each node.
My function GetStats() uses the NodeNum simply as a label in case you wanted to join the individual node data frames together.
If the tree has many nodes, these manual calculations would be very tedious. I do not see at the moment how to automate the calculations for the non-leaf nodes.
#Invent data
set.seed(1)
DF1 <- data.frame(Band = round(rnorm(30, 5, 0.7), 0),
                  MedianRate = runif(30, min = 0.25, max = 2.25),
                  Value = rnorm(30, 900, 50))
DF2 <- data.frame(Band = round(rnorm(30, 6, 0.7), 0),
                  MedianRate = runif(30, min = 0.5, max = 2.5),
                  Value = rnorm(30, 940, 50))
DF <- rbind(DF1, DF2)

library(rpart)
library(rpart.plot)
library(dplyr)

fit <- rpart(Value~Band+MedianRate, data=DF, method="anova")
rpart.plot(fit)
#Calculate statistics of the leaves
LeafStats <- DF %>% mutate(LeafNum = fit$where) %>%
  group_by(LeafNum) %>%
  summarise(Mean = mean(Value), Median = median(Value),
            Min = min(Value), Max = max(Value), N = n())
LeafStats #See the print out of Frame below to understand LeafNum
#> # A tibble: 5 x 6
#>   LeafNum  Mean Median   Min   Max     N
#>     <int> <dbl>  <dbl> <dbl> <dbl> <int>
#> 1       3  879.   869.  810.  944.    15
#> 2       5  909.   920.  837.  999.    13
#> 3       6  942.   930.  894. 1007.    12
#> 4       8  916.   931.  863.  955.     9
#> 5       9  946.   929.  882. 1044.    11

###Node Calculations
Splits <- fit$splits
Splits
#>            count ncat      improve     index       adj
#> MedianRate    60   -1 0.0578866182 1.7635074 0.0000000
#> Band          60   -1 0.0012291083 5.5000000 0.0000000
#> MedianRate    40    1 0.2155986209 1.1872099 0.0000000
#> Band          40    1 0.0002392061 5.5000000 0.0000000
#> Band          25   -1 0.1266509674 5.5000000 0.0000000
#> MedianRate    25   -1 0.1038963104 0.7519308 0.0000000
#> MedianRate     0   -1 0.7200000000 0.9077468 0.4166667
#> MedianRate    20    1 0.1026266061 2.0550743 0.0000000
#> Band          20   -1 0.0111632486 5.5000000 0.0000000
#> Band           0    1 0.6500000000 6.5000000 0.2222222
Frame <- fit$frame
Frame
#>           var  n wt        dev     yval complexity ncompete nsurrogate
#> 1  MedianRate 60 60 142627.676 916.1906 0.09688132        1          0
#> 2  MedianRate 40 40  89887.778 907.8959 0.09688132        1          0
#> 4      <leaf> 15 15  18247.778 879.4796 0.01000000        0          0
#> 5        Band 25 25  52260.318 924.9457 0.04640628        1          1
#> 10     <leaf> 13 13  30606.923 909.3128 0.01000000        0          0
#> 11     <leaf> 12 12  15034.576 941.8814 0.01000000        0          0
#> 3  MedianRate 20 20  44483.665 932.7800 0.03200787        1          1
#> 6      <leaf>  9  9   8638.785 916.0772 0.01000000        0          0
#> 7      <leaf> 11 11  31279.672 946.4460 0.01000000        0          0

GetStats <- function(x, NodeNum) {
  summarise(x, Mean = mean(Value), Median = median(Value),
            Min = min(Value), Max = max(Value),
            N = n(), Perc = n()/nrow(DF)) %>%
    mutate(Node = NodeNum)
}

Node2 <- DF %>% filter(MedianRate < Splits[1, "index"])
Node2Stats <- GetStats(Node2, NodeNum = 2)
Node2Stats
#>       Mean   Median      Min      Max  N      Perc Node
#> 1 907.8959 912.0706 809.7521 1007.152 40 0.6666667    2

Node3 <- DF %>% filter(MedianRate >= Splits[1, "index"])
Node3Stats <- GetStats(Node3, NodeNum = 3)
Node3Stats
#>     Mean   Median      Min      Max  N      Perc Node
#> 1 932.78 930.1466 862.8363 1044.358 20 0.3333333    3

Node4 <- Node2 %>% filter(MedianRate >= Splits[3, "index"])
Node4Stats <- GetStats(Node4, NodeNum = 4)
Node4Stats
#>       Mean   Median      Min      Max  N Perc Node
#> 1 879.4796 869.3987 809.7521 944.0554 15 0.25    4

Node5 <- Node2 %>% filter(MedianRate < Splits[3, "index"])
Node5Stats <- GetStats(Node5, NodeNum = 5)
Node5Stats
#>       Mean   Median      Min      Max  N      Perc Node
#> 1 924.9457 923.7865 837.3183 1007.152 25 0.4166667    5
Created on 2019-10-11 by the reprex package (v0.3.0.9000)