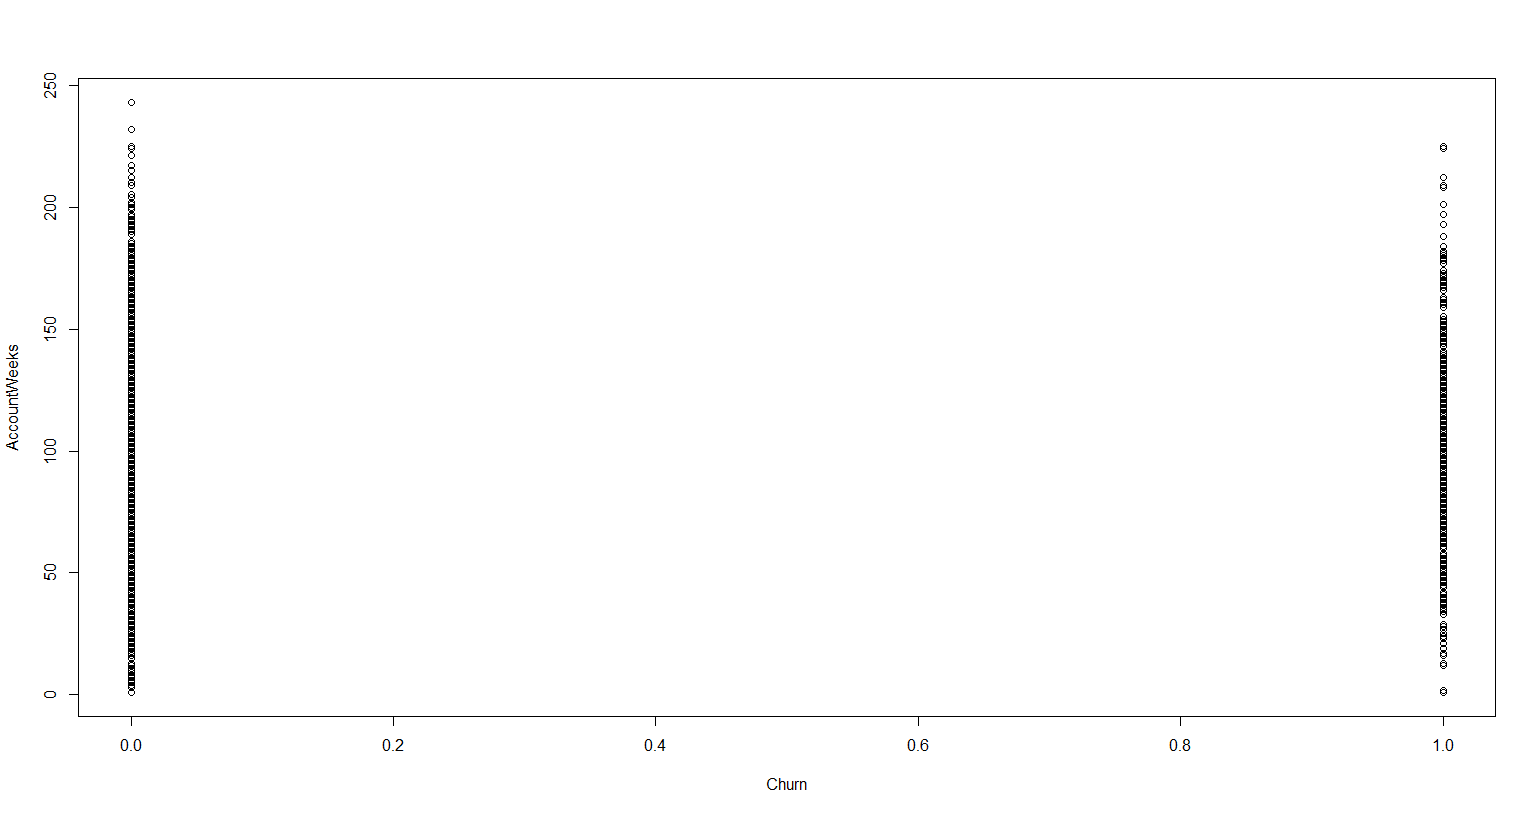
Why is the plot showing a range between 0 and 1 when it is clearly specified as a factor variable with two levels .
Screenshots are very rarely useful. Please help us help you by posting a reproducible example.
1 Like
system
Closed
3
This topic was automatically closed 21 days after the last reply. New replies are no longer allowed.