Visualizing Canadian Election Results
Authors: Dylan Anderson
Abstract: Get a better look at how Canadians voted in the 2015 and 2019 Federal Elections. By mapping the results using Elections Canada data and shapefiles, users can better understand how individuals voted from a country-wide view all the way down to their community.
Vote statistics are broken down by the five major parties and provide a percentage share of the vote in addition to the number of actual seats and total votes. Scroll in and out of the map as you please, providing interactive views at each level you want to view (by province, riding or poll)
Full Description: Check The App Out Here
In this project, I used the power of R to better understand how Canadians voted in the past two elections (2015 & 2019). Using the combination of R as a backend and RShiny as a front end provided the potential to combine hundreds of individual data files, calculate actual vote totals and visualize them in helpful graphs and maps that can help the average non-political junkie understand the world of Canadian politics and elections. Each party is also coloured with their official colours for the benefit of consistency!
To visualize this in a succinct way, I created four separate views for my app:
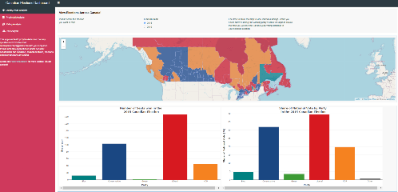
1. Country-Wide Analysis
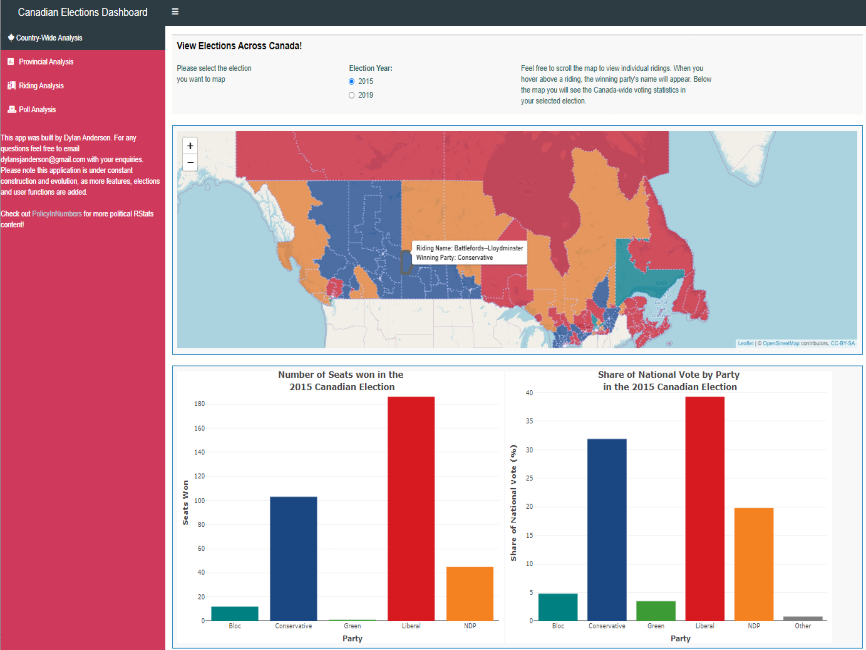
How did the whole country vote at a federal level? How many seats did each major party win and what share of the vote did they receive?
With a leaflet map and plotly graphs, this country-wide view provides a level of interactivity that is not available when you visit Elections Canada's website. Toggle between 2015 and 2019 to see how the colours on the map and the vote totals change!
2. Provincial Analysis
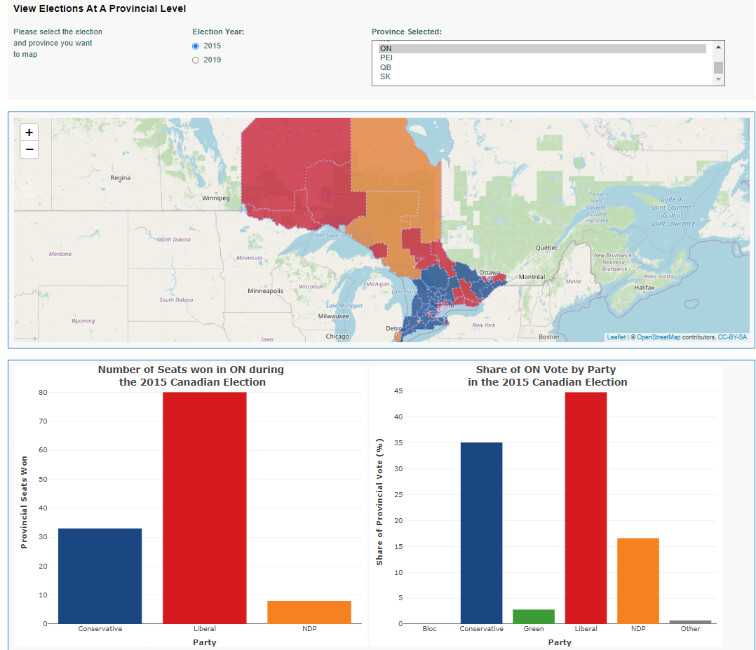
Using the input selection at the top, choose your province and see how the map colours out. Then use the graphs to understand how many seats and share of vote each party garnered. If you aren't from Canada, the provincial legend is at the bottom of this description (adding names is a future update in the app). Also hover over the ridings to see the share and vote breakdown by individual riding!
Note: Territories (the areas in the north) are not shown at the Provincial level as they only include one riding.
3. Riding Analysis
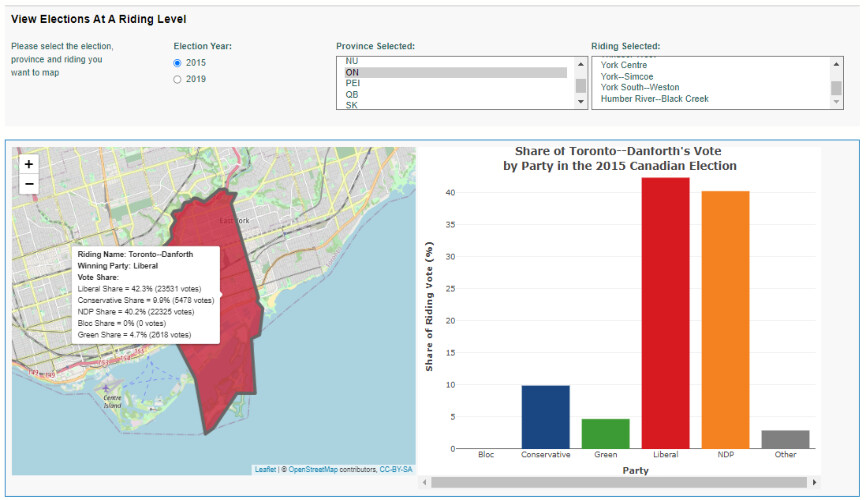
If you want to get a closer view, take a look at how each riding voted, while viewing the geographical region on the map. The colour of the map shade denotes the winning riding, of which you will see their winning vote share on the right!
4. Poll Analysis
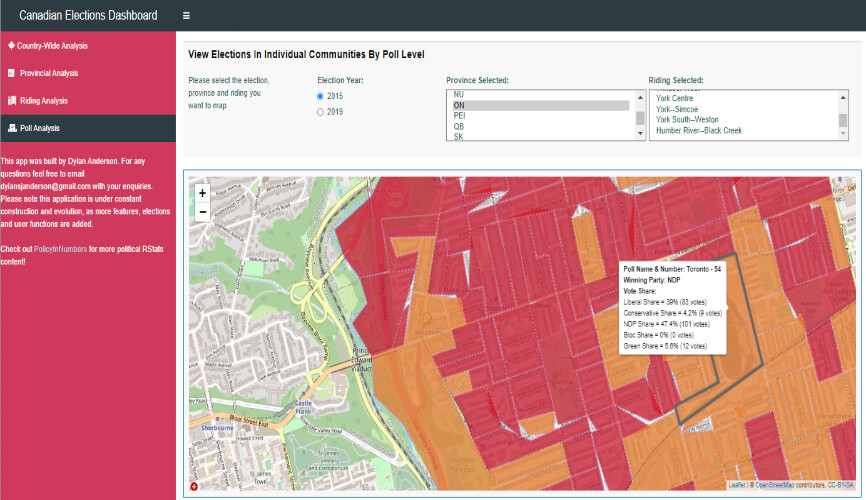
Finally, dig down into the political detail necessary to understand individual communities. With votes broken down at levels in the few hundreds, the Poll level view gives users the drill-down capacity to understand whether one street over from your house voted differently than yours.
Provinces/ Territories Legend:
AB - Alberta
BC - British Columbia
MB - Manitoba
NB - New Brunswick
NL - Newfoundland
NS - Nova Scotia
NT - Northwest Territories
NU - Nunavut
ON - Ontario
PEI - Prince Edward Island
QB - Quebec
SK - Saskatchewan
YU - Yukon
Politics and elections are too important not to use R and other data science tools to visualize and teach people about. Check out my blog Policy In Numbers to learn more about how to combine R and politics to create interesting and important implications/ visualizations.
Future iterations will add more political analysis and elections. For example, how did vote share change? Or what regions skewed most heavily for certain parties? Feedback and comments are also always welcome! Finally, since the poll-level shapefiles use a high amount of memory, the app might run a bit slow at times and not work if too many users are on it, so if that is the case, have patience ![]()
Keywords: politics, Canada, leaflet, elections, government, plotly
Shiny app: https://danderson.shinyapps.io/Canada-Electoral-Model/
Repo: GitHub - danderson222/Canada-Electoral-Model: Explore the results of the 2015 & 2019 Canadian federal elections with Shiny!
RStudio Cloud:
Thumbnail:
Full image: