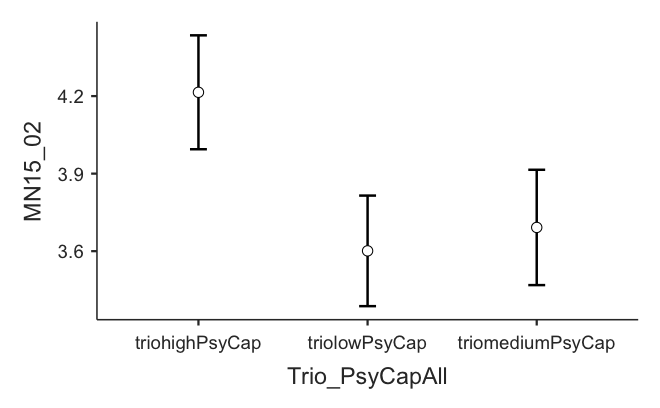
Hi! To analyse my data I have to calculate a lot of different one-way ANOVAs. To do that I use the dmv/devtools package. The output of every ANOVA generates a nice box plot for the variable (I attached an image). I would now like to generate a visualisation with all my box plots (about 90 of them). Moreover, I would like to color-code the box plots according to the significance level. Do you think this is even possible? A few attempts with ggplot2-commands have yielded very weird results. Thank you!
This is the output I get for the ANOVA:
ANOVA
ANOVA - MN15_02
───────────────────────────────────────────────────────────────────────────────────
Sum of Squares df Mean Square F p
───────────────────────────────────────────────────────────────────────────────────
Overall model 36.21903 2 18.109513 8.831599 0.0001705
Trio_PsyCapAll 36.21903 2 18.109513 8.831599 0.0001705
Residuals 1008.86380 492 2.050536
───────────────────────────────────────────────────────────────────────────────────
POST HOC TESTS
Post Hoc Comparisons - Trio_PsyCapAll
─────────────────────────────────────────────────────────────────────────────────────────────────────────────────────────────────
Trio_PsyCapAll Trio_PsyCapAll Mean Difference SE df t p-tukey Cohen's d
─────────────────────────────────────────────────────────────────────────────────────────────────────────────────────────────────
triohighPsyCap - triolowPsyCap 0.61356786 0.1563099 492.0000 3.9253293 0.0002912 0.42847835
- triomediumPsyCap 0.52290003 0.1596134 492.0000 3.2760413 0.0032276 0.36516147
triolowPsyCap - triomediumPsyCap -0.09066783 0.1573190 492.0000 -0.5763311 0.8328251 -0.06331688
─────────────────────────────────────────────────────────────────────────────────────────────────────────────────────────────────
Note. Comparisons are based on estimated marginal means
ESTIMATED MARGINAL MEANS
TRIO_PSYCAPALL
Estimated Marginal Means - Trio_PsyCapAll
─────────────────────────────────────────────────────────────────────
Trio_PsyCapAll Mean SE Lower Upper
─────────────────────────────────────────────────────────────────────
triohighPsyCap 4.214724 0.1121605 3.994351 4.435097
triolowPsyCap 3.601156 0.1088706 3.387247 3.815065
triomediumPsyCap 3.691824 0.1135626 3.468696 3.914951
─────────────────────────────────────────────────────────────────────