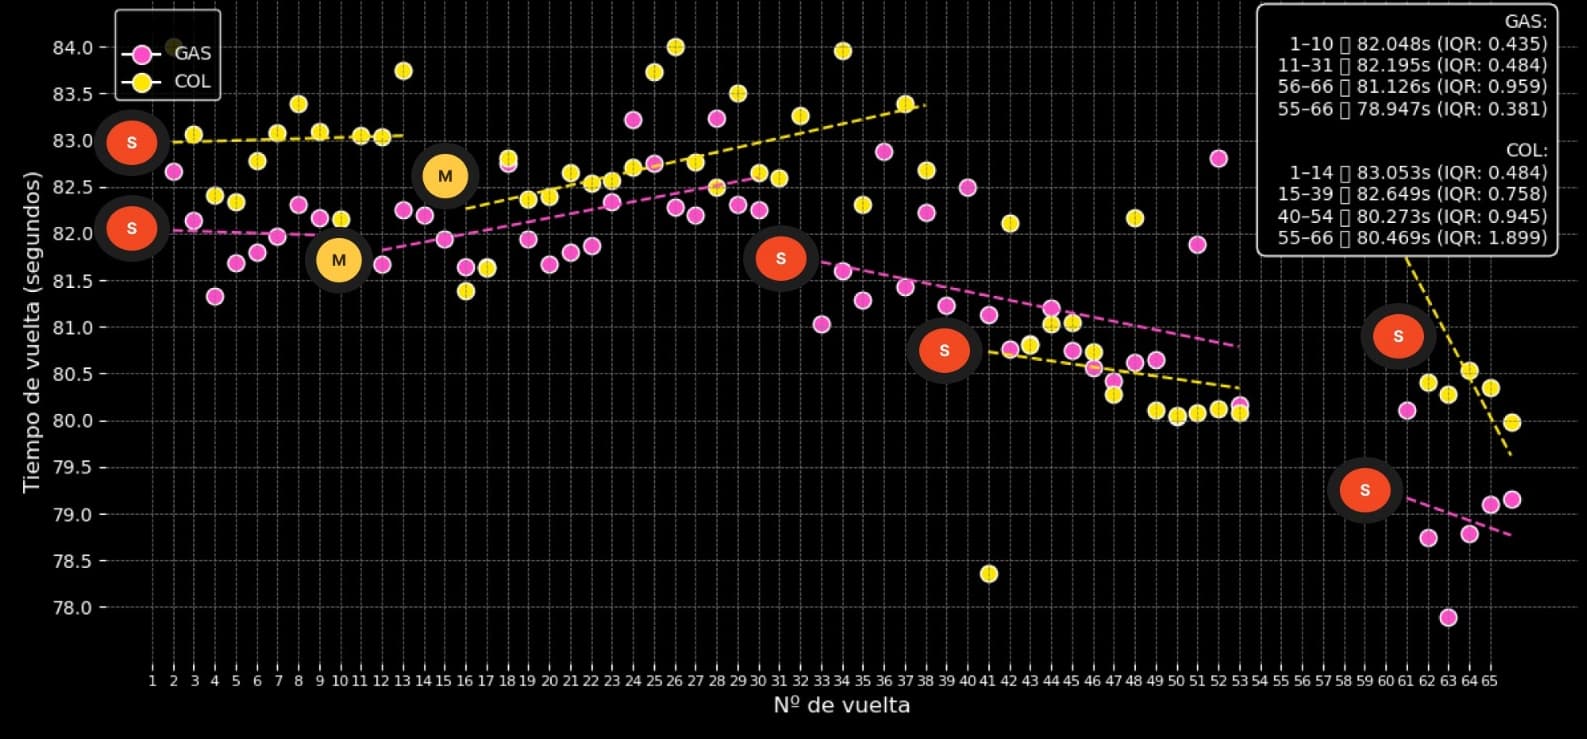
buen día!! necesito hacer un grafico de este tipo
me salen 6 gráficos desconectados
FJCC
June 8, 2025, 7:58pm
2
Please show us your code and a little of your data. To share data, post the output of the dput() function. To show 20 rows of data from a data frame named DF, run
dput(head(DF,20))
You may also find this helpful.
A minimal reproducible example consists of the following items:
A minimal dataset, necessary to reproduce the issue
The minimal runnable code necessary to reproduce the issue, which can be run
on the given dataset, and including the necessary information on the used packages.
Let's quickly go over each one of these with examples:
1 Like
system
September 7, 2025, 10:31am
4
This topic was automatically closed 90 days after the last reply. New replies are no longer allowed.