Visualization of meteorological and pollutant data - English Version
Authors: Edgar Luis Cáceres Angulo, Andrés Daniel Brios Abanto, Guisella Johanna Sanchez Ramos
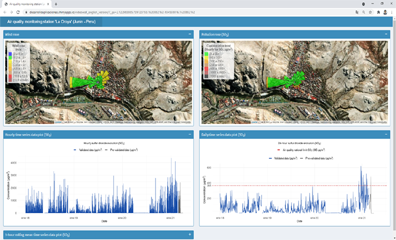
Abstract: An application to visualize air quality data with validated and pre-validated data, time series graphs, traditional wind rose plot and pollution rose variation (rasterize an image on interactive maps with leaflet and labels with latex2exp)
Full Description: Complete description:
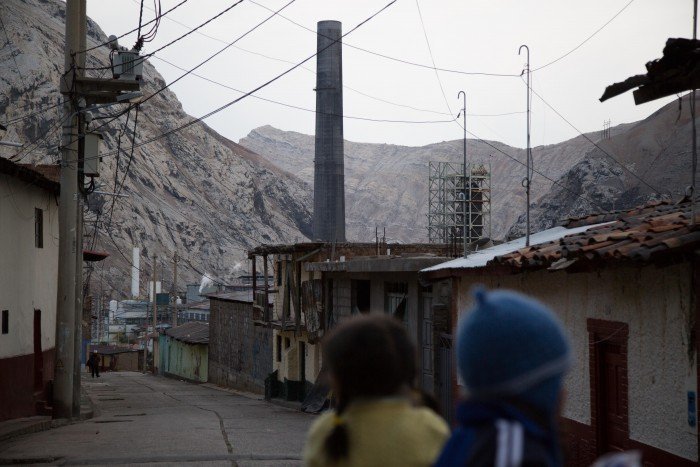
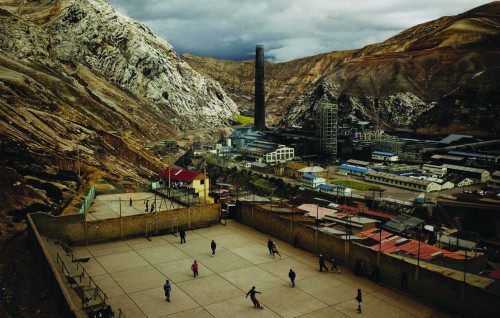
Presentation of data from one of the air quality station located in the city of La Oroya, Junín, Peru.
This application allows you to view data in graphs of time series validated and pre-validated hourly (1 hour), daily (24 hours) and 3-hour moving average of the sulfur dioxide (SO2) pollutant.
The data has an advance treatment which is validated in time periods of 5 minutes, 1 hour and 24 hours and is displayed in the time series with its respective legend. Graphics have transparency effects on captions, wind roses, and pollutant. The graphic titles of the series and graphs are designed with HTML, and the texts such as indexes and supra indexes are designed and created with Latex codes
The traditional wind rose plot way of dividing the circle to indicate the different directions of the North, South, East and West, from these the horizon is divided into four parts of 90º each. It has two main components: wind speed and direction.
A pollution rose variation is a graphic database, which indicates the direction of the emission sources that influence a certain station. It has three main components: wind speed, wind direction, and concentration levels.
The libraries used are: tidyverse, shiny, shinydashboard, leaflet, readxl, lubridate, recoder, openair, ggplot2, rlang, latex2exp.
Keywords: shinydashboard, leaflet, openair, ggplot2, latex2exp, visualize air quality data, rasterize an image on interactive maps
Shiny app: https://desarrolloaplicaciones.shinyapps.io/videowall_english_version/
Repo: GitHub - edgarcaceresangulo/videowall_english_version: Visualization of meteorological and pollutant data - english version | Edgar Cáceres
RStudio Cloud: Posit Cloud
Thumbnail:
Full image: