I need to write some code and explain it to real humans.
The code will query a database and give a result combining info from several tables.
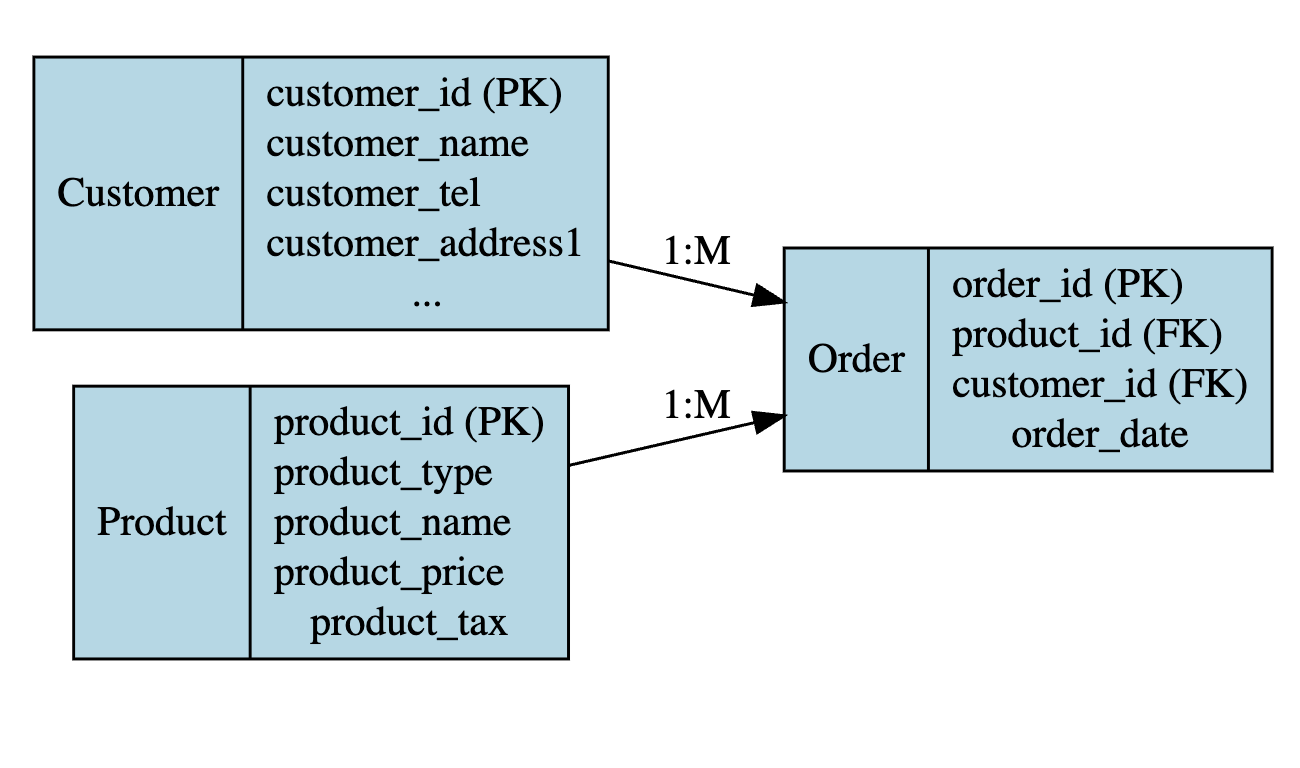
For a simple worked example, lets assume I have a database with customers, products and orders in tables. And my query is to show all customers who purchased a certain product type over time.
The SQL might be something like:
--- code to build the tables
CREATE TABLE tbl_customer
( customer_id   varchar(10) NOT NULL,
  customer_name   varchar(40) NOT NULL,
  customer_tel     varchar(10) ,
  customer_address1 varcahr(80),
  customer_address2 varcahr(80),
  customer_address3 varcahr(80),
  customer_city varcahr(25),
  customer_postcode varcahr(10),

);
GO

CREATE TABLE tbl_product
( product_id   int NOT NULL,
  product_type   varchar(11) NOT NULL,
  product_name   varchar(40) NOT NULL,
  product_price money NOT NULL,
  product_tax bolean,
);
GO

CREATE TABLE tbl_order
( order_id   int NOT NULL,
  product_id   int NOT NULL,
  customer_id     varchar(10) NOT NULL,
  FOREIGN KEY(product_id) REFERENCES tbl_product(product_id),
  FOREIGN KEY(customer_id) REFERENCES tbl_customer(customer_id),
);
GO

--- code to query the tables
SELECT
  C.customer_id,
  C.customer_name,
  C.customer_tel,
  O.order_date,
  P.product_name

FROM
  tbl_customer AS C

LEFT JOIN
  tbl_order O ON C.customer_id = customer_id
LEFT JOIN
  tbl_product P ON O.product_id = product_id

WHERE
P.product_type = 'chocolate'
By any chance is there some really clever R tool that can take that code and visualise it into something like an ER diagram. (ER diagrams usually need the relationship etc)
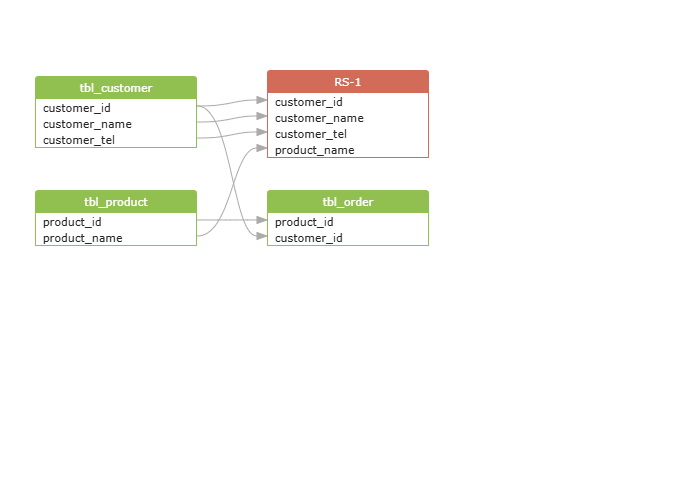
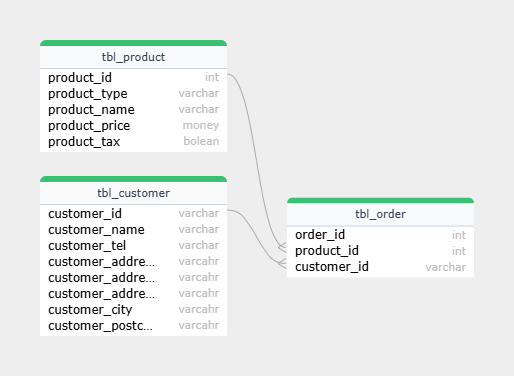
The two diagrams above come from a webtool SQLFlow. But to do it, I'm creating the table structure in the SQL which I don't want to do (my real database is massive, and a lot of the relationships are not defined by the database author).
My gut feeling says there will be a R package and I just don't know it!