Visualise Fitted Glm Coefficients With Base Levels
Authors: Jared Fowler
Affiliations:
Abstract: The package prettyglm makes it easy to visualise fitted glm coefficients. The function pretty_coefficients() produces a static html table. Features of this table include:
- Variables and levels being split into seperate columns.
- Variable importance column, which can easily be visualised.
- Inclusion of categorical variable base levels in the table.
- Colorised P Values to quickly identify insignificant coefficients.
- Option to conduct a type III test on the variables.
Full Description: One advantages of Generalised Linear Models is their interoperability. The goal of the prettyglm package is to easily create beautiful views to visualise the fitted model.
To the best of my knowledge no current tool exists which can create a beautiful summary table (including categorical base levels) with one function call. The first function in this package has been submitted to this competition. The function pretty_coefficients() provides an alternative to summary() too easily visualise coefficients of the fitted model in a static html table.
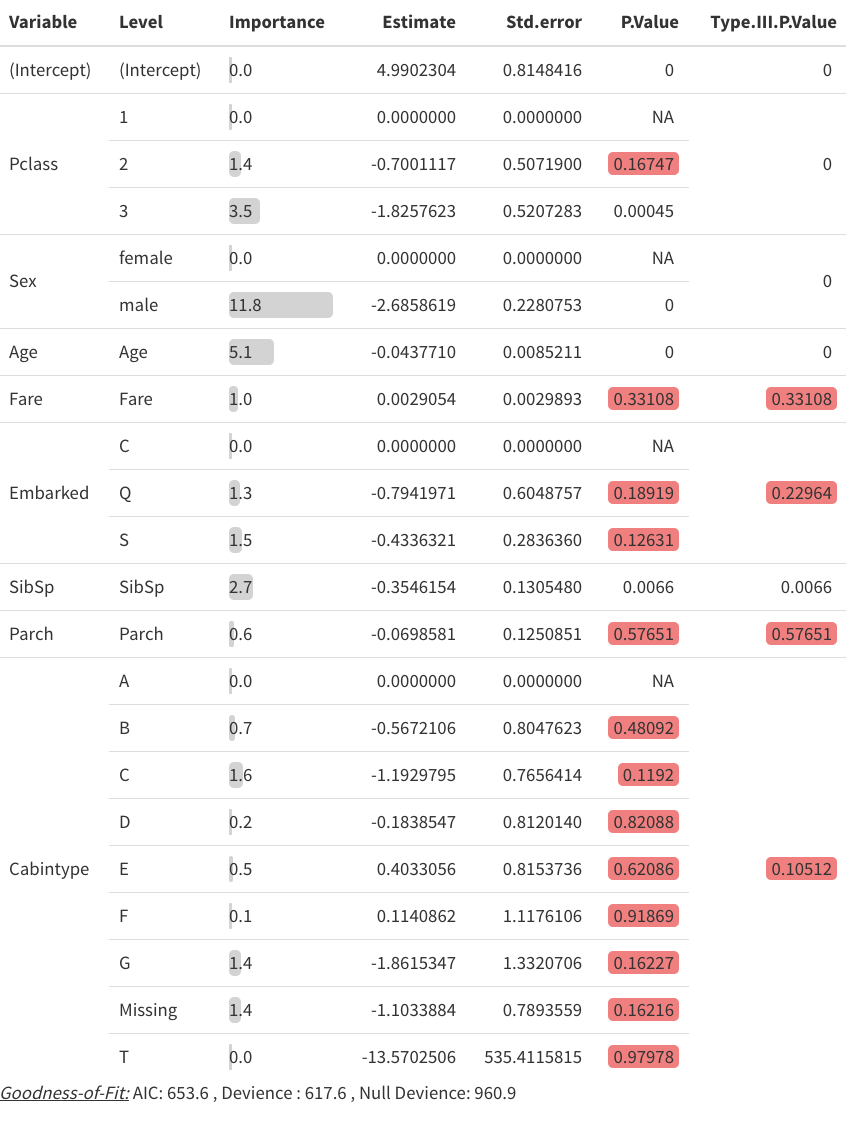
Table Type: static-HTML
Submission Type: Other
Table: GitHub - jared-fowler/prettyglm: prettyglm provides a set of functions which can easily create beautiful coefficient summaries which can readily be shared and explained.
Repo: GitHub - jared-fowler/prettyglm: prettyglm provides a set of functions which can easily create beautiful coefficient summaries which can readily be shared and explained.
RStudio Cloud:
DT package used:
gt package used:
reactable package used:
flextable package used: true
huxtable package used:
kableExtra package used: true
Other packages: kable