Good morning all
I need your help with a project on front particles as a function of water temperature and salinity.
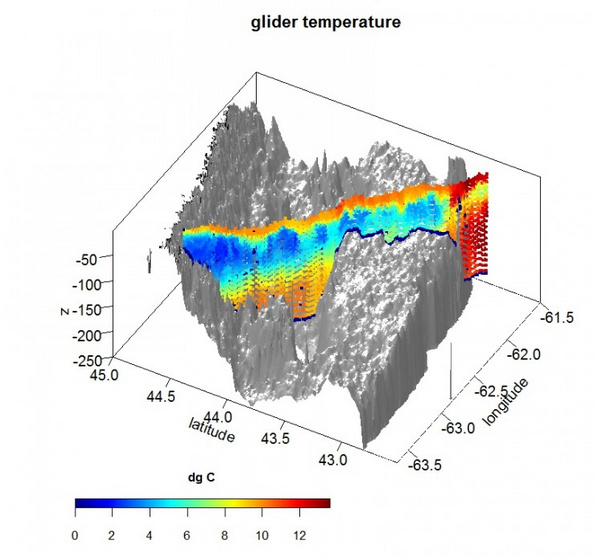
I would like to make a temperature glider based on latitude and longitude.
I manipulated my data in order to have a different column for:
- the sites
- longitude
-latitude
-temperature - the volume of particles
- the depth
And suddenly I would like to make a graph with x depth, y latitude and z longitude like the picture
Hoping someone can tell me the code to follow, thank you very much