Dear R professionals,
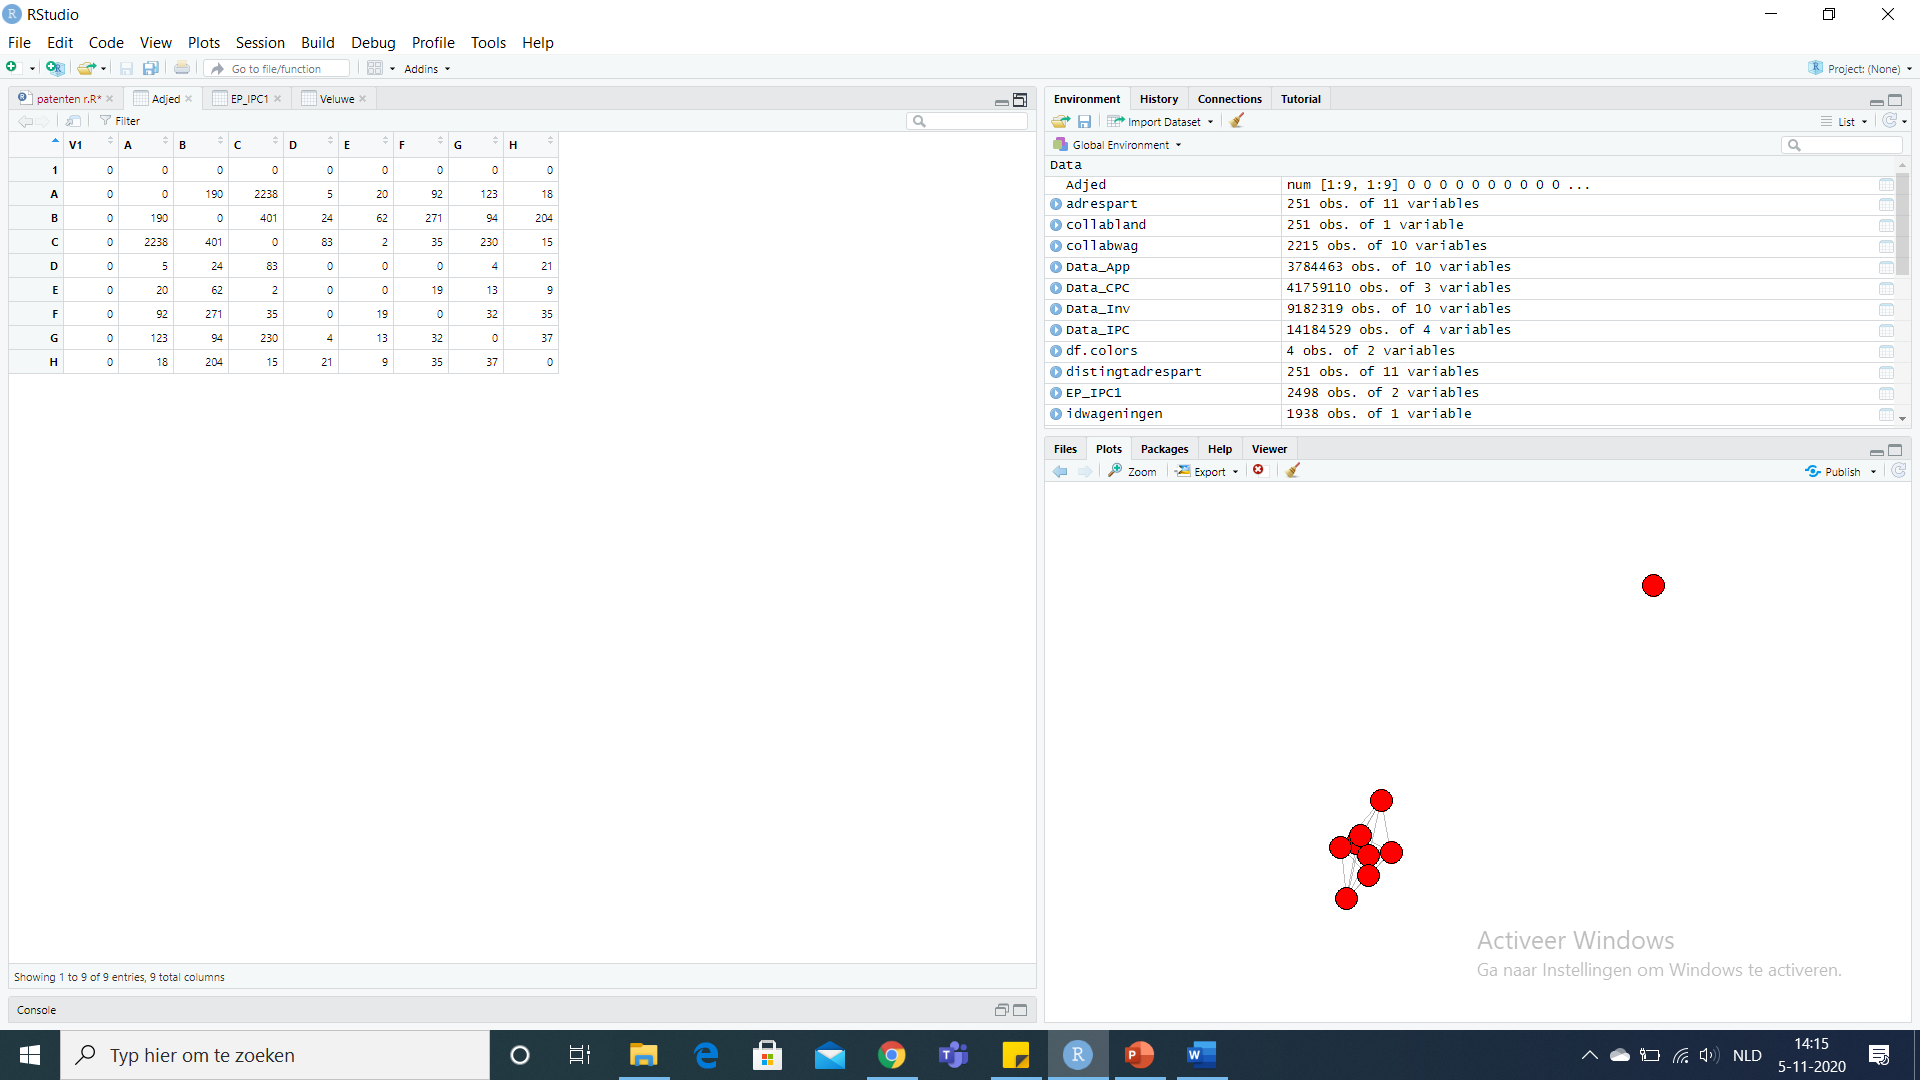
I have a question I have greated a graph using the graph adjecency function. The problem is that all the nodes have the same collor and it is also not clear to which value (A-H) they corrospond. we used this function. We want them to all have different collour and show the letter value.
wagtechspace2 <- graph.adjacency(Adjed, mode = c("undirected"), weighted = TRUE)
plot(wagtechspace2,
layout = layout_with_fr,
vertex.color = "red",
vertex.label = NA,
edge.width = E(wagtechspace2)$weight/max(E(wagtechspace2)$weight),
edge.color = rgb(.5,.5,.5,.5))
The deput fucntion gives us this but we have so much data open in R so I am unsure what it represents. dput(head(iris, 5)[c("Sepal.Length", "Sepal.Width")])
This is the data we have as imput