Visual Artifact in RStudio plotting window

Hi,

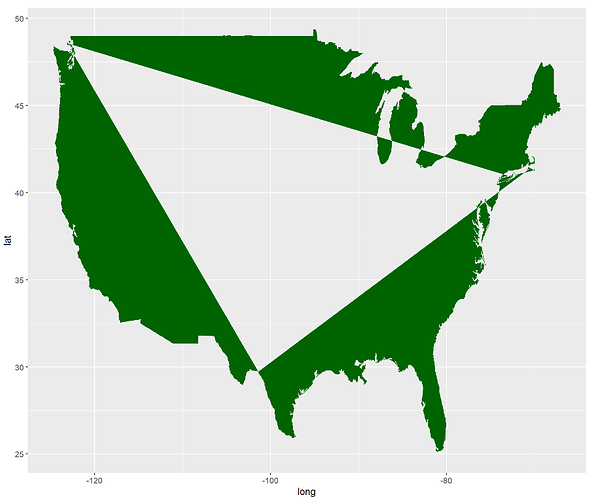
When plotting a map of the USA using ggplot2 and maps data, it results in a large triangle missing from the center.

Code:

library("maps")
library("tidyverse")
usa <- map_data("usa")
ggplot(usa) +
geom_polygon(aes(x = long, y = lat), fill = "darkgreen")

results in the following:

But when exported to a pdf the image is complete.

Versions:
Windows - 10
RStudio - 2021.09.1 Build 372
R - 4.1.1

Not sure what the cause of this problem may be.
try plotting only group 1

library("maps")
library("tidyverse")
usa <- map_data("usa") %>% filter(group==1)
ggplot(usa) +
  geom_polygon(aes(x = long, y = lat))

That works great, thank you

This topic was automatically closed 7 days after the last reply. New replies are no longer allowed.

If you have a query related to it or one of the replies, start a new topic and refer back with a link.