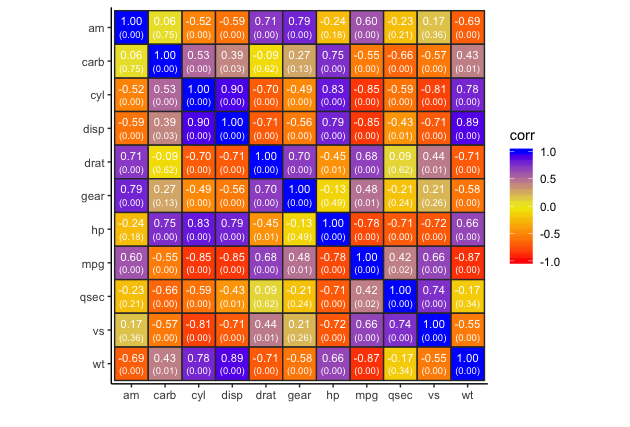
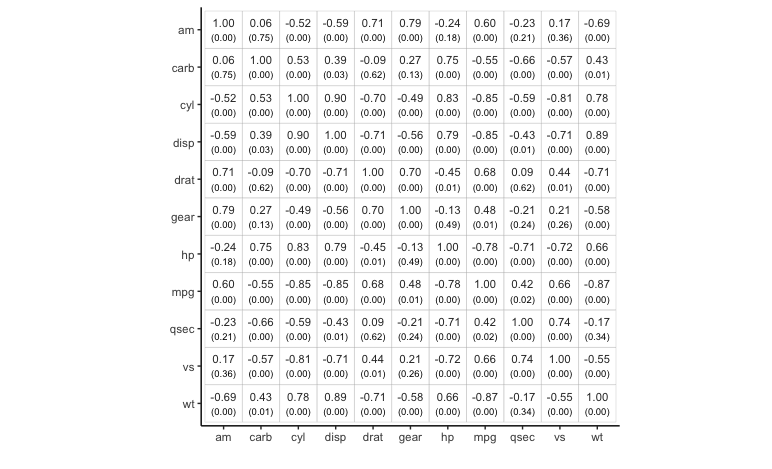
I haven't used corrplot in a while and can't remember how to do that, but this type of plot isn't that hard to whip up in ggplot. For example, the code below generates the appropriate data frame and then plots the correlations and p-values. In the first example, I've plotted only the numbers, but you can also plot markers with sizes and fill colors mapped to the correlations and/or p-values or map a value to the fill color in geom_tile.
library(tidyverse)

# Function to get correletions and p.values in a "long" data frame
corr.data = function(data) {

  # Get correlations
  cor.vals = cor(data)

  # Get p-values
  cor.p = cor.mtest(data, conf.level = 0.95)$p
  rownames(cor.p) = rownames(cor.vals)
  colnames(cor.p) = colnames(cor.vals)

  cbind(rowvars=rownames(cor.vals), data.frame(cor.vals)) %>%
    gather(colvars, corr, -rowvars) %>%
    left_join(cbind(rowvars=rownames(cor.p), data.frame(cor.p)) %>%
                gather(colvars, p.value, -rowvars))
}
# Create plot
corr.data(mtcars) %>%
  ggplot(aes(colvars, fct_rev(rowvars))) +
    geom_tile(colour="grey70", fill=NA) +
    geom_text(aes(label=sprintf("%1.2f", corr)), position=position_nudge(y=0.2),
                      size=3, colour="grey20") +
    geom_text(aes(label=paste0("(",sprintf("%1.2f", p.value),")")), position=position_nudge(y=-0.2),
                      colour="grey20", size=2.5) +
    labs(x="",y="") +
    theme_classic() +
    coord_fixed()
Or, with the tile fill mapped to correlation:
corr.data(mtcars) %>%
  ggplot(aes(colvars, fct_rev(rowvars))) +
  geom_tile(colour="grey20", aes(fill=corr), size=0.5) +
  #geom_point(aes(size=p.value, colour=cut(abs(corr), c(0, 0.01, 0.05, 1), include.lowest=TRUE)), pch=15) +
  geom_text(aes(label=sprintf("%1.2f", corr)), position=position_nudge(y=0.2),
            size=3, colour="white") +
  geom_text(aes(label=paste0("(",sprintf("%1.2f", p.value),")")), position=position_nudge(y=-0.2),
            size=2.5, colour="white") +
  scale_fill_gradient2(low="red", mid="yellow2", high="blue", midpoint=0, limits=c(-1,1)) +
  scale_size_continuous(range=c(8,12)) +
  labs(x="",y="") +
  theme_classic() +
  coord_fixed()
Well, it's a bit busy, but hopefully this gives you an idea of what's possible.

Editorial comment: Recent articles on pitfalls of p-values and null-hypothesis significance testing: here, here, and here.
