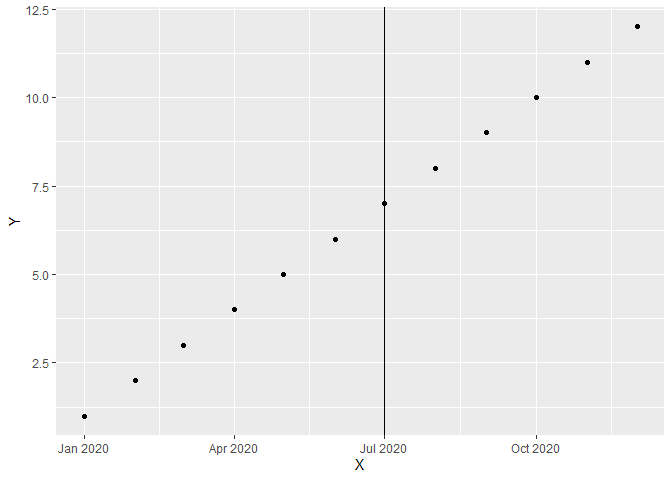
I have some script that produces a GGplot as follows. I am trying to insert a vertical line at "2020-07-16" however i have tried the three following lines and none have worked. I am wondering what I am missing here.
  abline(v="2020-07-16", col="blue") +
  abline() +
geom_hline(aes(xintercept=as.Date("2020-07-16"), colour="#990000", linetype="dashed") + #This is our control line of current CFR
ggplot(CFR_Table, aes(x = CFR_Table$Date, y = CFR_Table$CFR_estimate_temp)) +
  geom_text(x=as.Date("2020-05-21"), y=0.30, label="Estimated CFR: ~2%") +
  geom_text(x=as.Date("2020-05-21"), y=0.20, label="Control CFR: 1.4%") +
  geom_hline(aes(yintercept=0.014), colour="#990000", linetype="dashed") + #This is our control line of current CFR
  abline(v="2020-07-16", col="blue") +
  abline() +
  scale_y_continuous(labels = function(x) paste0(x*100, "%")) +
  scale_x_date(breaks = seq.Date(from = as.Date("2020-03-07"),
                                 to = as.Date("2020-07-30"), by = 25)) +
  geom_line() +
  theme(panel.grid.major = element_blank(), panel.grid.minor = element_blank(),
        panel.background = element_blank(), axis.line = element_line(colour = "Black")) +
  labs(title = "Case Fatality Rate (CFR) in Canada", subtitle = "Case Fatality Rate Over-Estimate)",
       x = "Date", y = "CFR In Percent", caption = "Data Collected From Johns Hopkins Center for Systems Science & Engineering") +
  ggsave("~/Desktop/CFR_Project/Canada/CFR_Over_Estimate_Canada.png", plot = last_plot())