Venomous Serpent Analysis
Authors: Shiyas Karim, Amrita Krishna
Working with Shiny < 1 year
Abstract: Based on the WHO reports on global level yearly 5.4 million people are effected due to snake bites, In north America alone there are 1.3 million people effected, so there is a small work from us on the analysis types of snakes that resides in each an every town of north America, we have scrapped numerous website for gathering data for this study, the major objective of this dashboard is to let people be aware of what type of snakes resides in each town of north America.
Full Description: Venomous Serpent analysis:
This dashboard helps you to understand and analyze the number of venomous and non-venomous species in each American state. And let the user know which species of snake resides in the current location of user. even the user gets the information on the toxicity of the snake in location. In case of any medical emergency the user has the access to locate the nearby medical facility in the current location and get the complete details on the facility.
Venomous Serpent analysis dashboard consists of 3 level of analysis divided into 3 sheets:
-
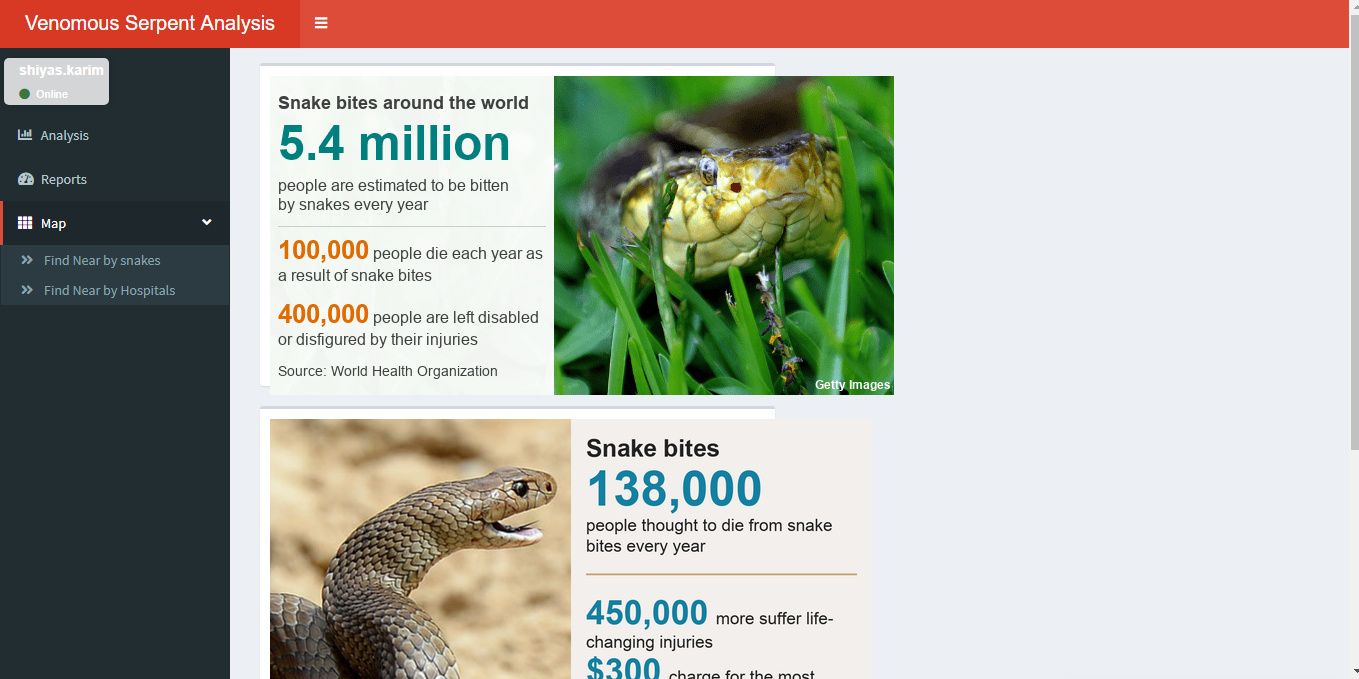
Home: This is the landing page of the dashboard and this page contains the information on the global level of deaths reported due to snake bites and a report on number of deaths in USA due to snake bites.
-
Analysis: This analysis is to compare the number of species of venomous and non-venomous snake in each state of North America.
-
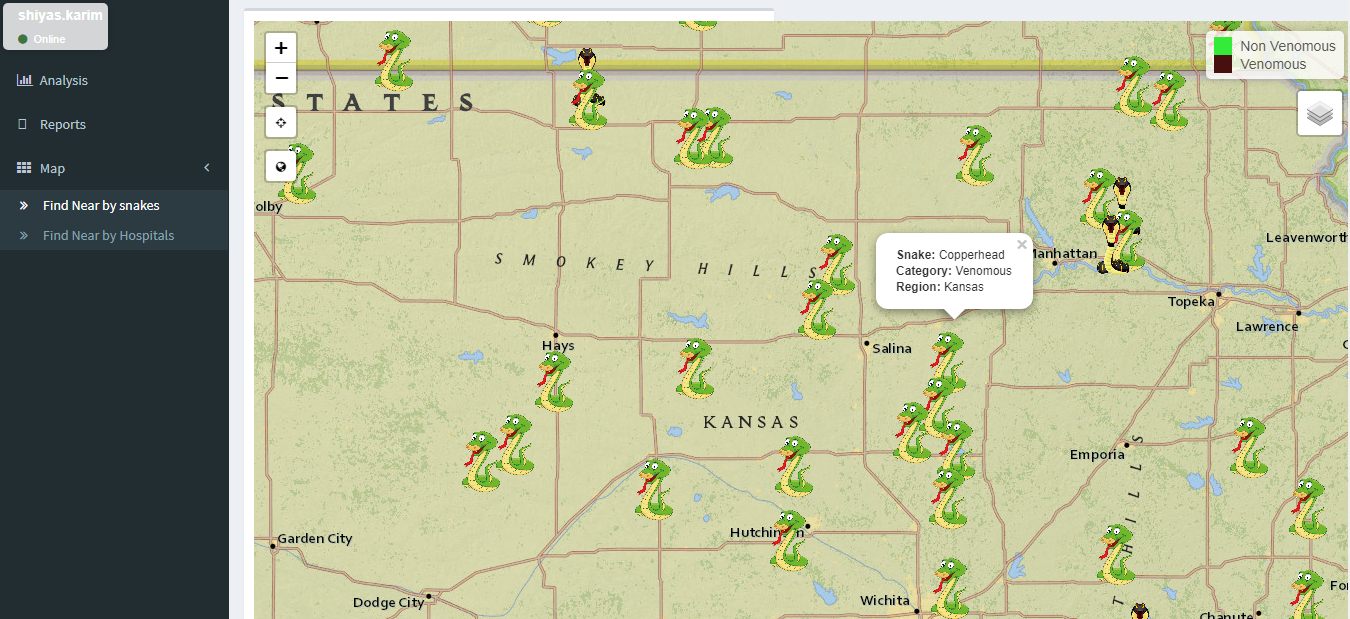
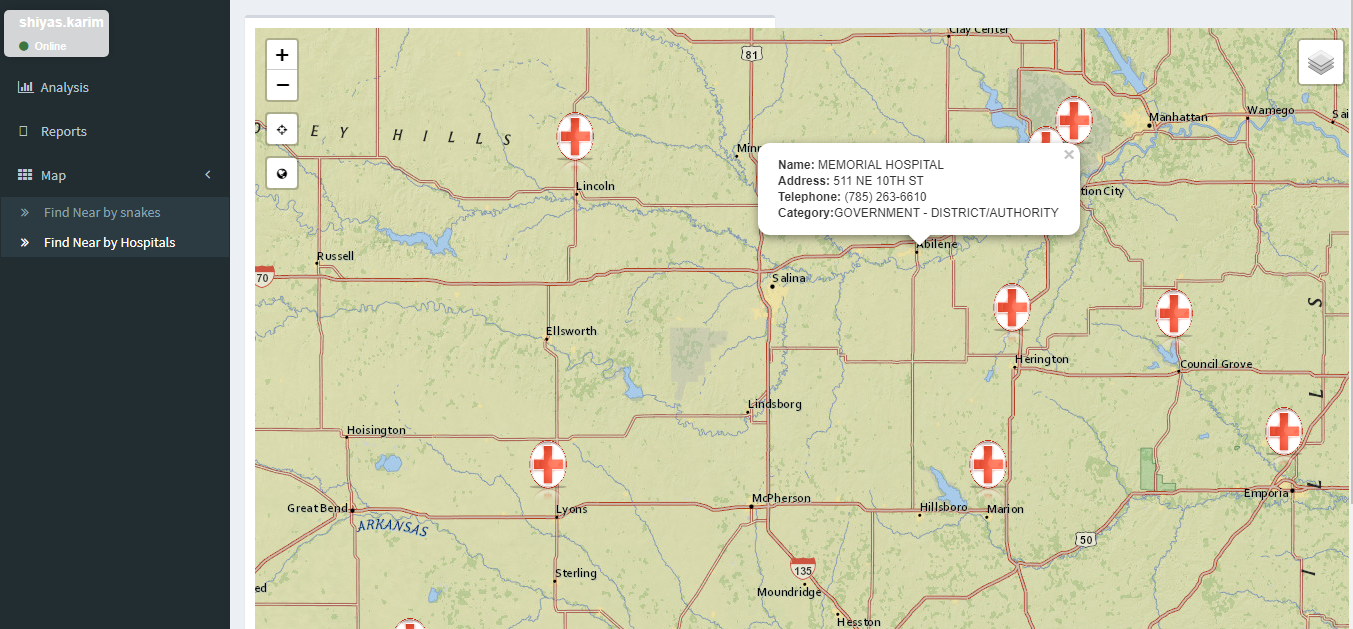
Geographic Analysis: This analysis is to show the demographic details of snake species and medical facility details in the current user’s location.
i. Find Nearby Snakes: locating the number of snake species in the user’s current location based on the GPS signals.
ii. Find Nearby Hospitals: Showing the nearby hospitals in the user’s current location based on the GPS signals.
**Use Google Chrome, Mozilla Firefox, Microsoft Edge for better result.
Category: Research
Keywords: Rshinycontest,analysis, wildlife, snakes, dashboard
Shiny app: https://shiyasdashaboards.shinyapps.io/Venamous_serpent_analysis/
Repo: https://github.com/shiyaskr/Rshiny_dashboard_venamous_serpent_analys
RStudio Cloud: Posit Cloud
Thumbnail:

Full image: