Pell
November 19, 2021, 9:11am
1
Hi,
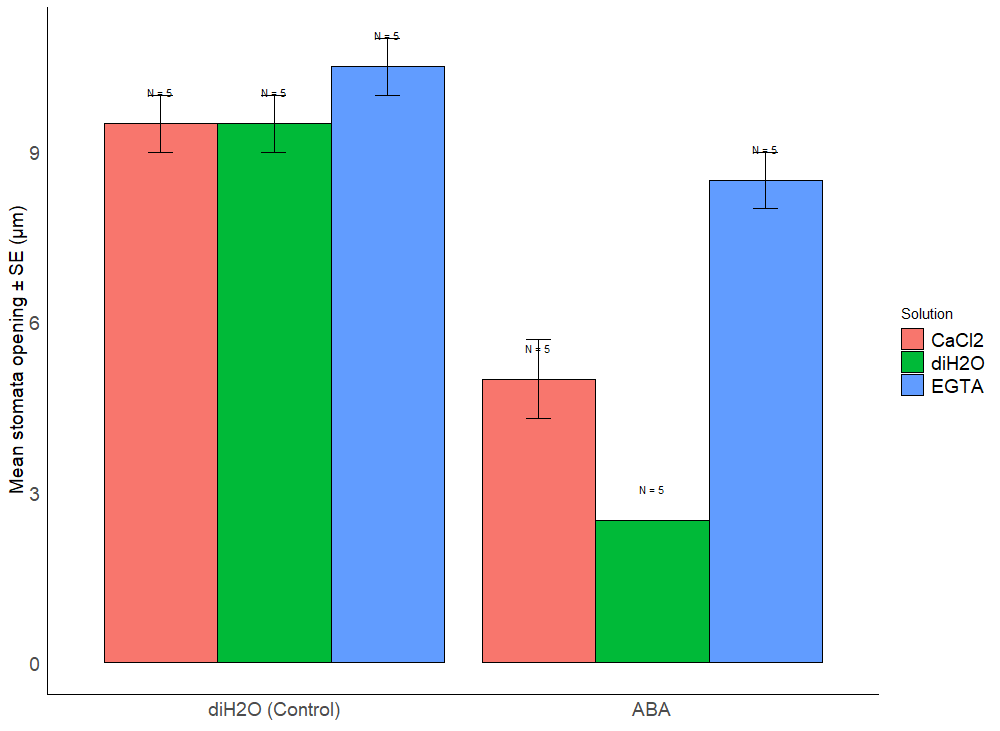
I'd like to use subscript in one of my x axis category names and change it from DiH2O (Control) to diH["2" as subscript]O (Control). I've seen plenty advice on how to add subscript to labels but couldn't find anything on category names. I tried playing around with scale_x_discrete but to no avail. Including the code and the graph below:
stomata_plt<-ggplot(data=stomata, aes(x=Control_ABA, y=Mean, fill=Solution))+
  geom_bar(stat="identity", color="black", position=position_dodge())+
  geom_text(aes(label="N = 5"), position=position_dodge(width=0.9), vjust=-3, size = 3)+
  geom_errorbar(aes(ymin=Mean-SE, ymax=Mean+SE), width=.2, position=position_dodge(.9))+
  theme_minimal()+
  scale_y_continuous("Mean stomata opening ± SE (µm)")+
  theme(axis.title.x = element_blank())+
  theme(
    panel.border = element_blank(),
    panel.grid.major = element_blank(),
    panel.grid.minor = element_blank())+
  theme(axis.text = element_text(size = 14))+
  theme(axis.title.y = element_text(size = 14))+
  theme(axis.line = element_line(size = 0.5, colour = "black", linetype=1))+
  theme(legend.text=element_text(size=14))
Does anyone have any idea of how to proceed?
some_data <- iris %>% group_by(Species) %>% summarise(msl = max(Sepal.Length))

(p1 <- ggplot(some_data) +
  aes(x=Species,y=msl)+geom_col() )

(p2 <- p1 +
  scale_x_discrete(labels={
   raw <- as.expression(as.character(pull(some_data,Species)))
  raw[1] <- expression(di["H20"])
    raw
  }))
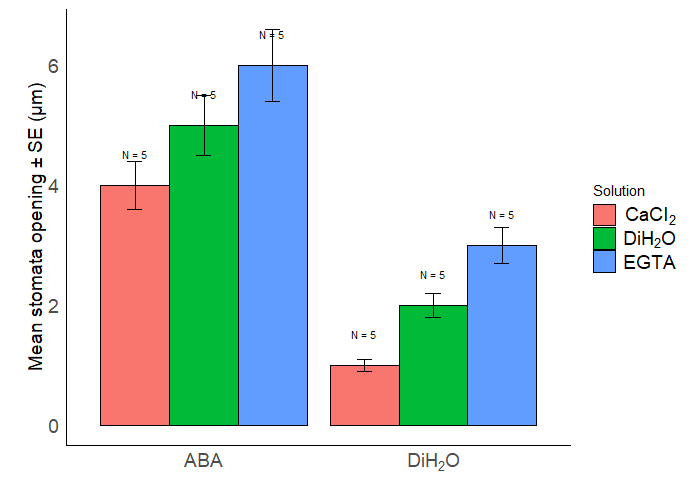
As usual @nirgrahamuk has the right solution. My example below shows how to use it in your case:
library(dplyr)
#>
#> Attaching package: 'dplyr'
#> The following objects are masked from 'package:stats':
#>
#>     filter, lag
#> The following objects are masked from 'package:base':
#>
#>     intersect, setdiff, setequal, union
library(ggplot2)


stomata = data.frame(
  Control_ABA = c(rep("DiH2O (Control)",3),rep("ABA",3)),
  Solution=rep(c("CaCI2","DiH2O","EGTA"),2),
  Mean= 1:6,
  SE = (1:6)/10
)

stomata
#>       Control_ABA Solution Mean  SE
#> 1 DiH2O (Control)    CaCI2    1 0.1
#> 2 DiH2O (Control)    DiH2O    2 0.2
#> 3 DiH2O (Control)     EGTA    3 0.3
#> 4             ABA    CaCI2    4 0.4
#> 5             ABA    DiH2O    5 0.5
#> 6             ABA     EGTA    6 0.6

my_labels1 <-c("DiH2O (Control)"=expression(DiH[2]*O),"ABA" = "ABA")
my_labels2 <-c("CaCI2"=expression(CaCI[2]),"DiH2O"=expression(DiH[2]*O),"EGTA"="EGTA")

stomata_plt<-ggplot(data=stomata, aes(x=Control_ABA, y=Mean, fill=Solution))+
  geom_bar(stat="identity", color="black", position=position_dodge())+
  geom_text(aes(label="N = 5"), position=position_dodge(width=0.9), vjust=-3, size = 3)+
  geom_errorbar(aes(ymin=Mean-SE, ymax=Mean+SE), width=.2, position=position_dodge(.9))+
  theme_minimal() +
  scale_y_continuous("Mean stomata opening ± SE (µm)") +
  scale_x_discrete(labels=my_labels1) +
  scale_fill_discrete(labels=my_labels2) +
  theme(axis.title.x = element_blank())+
  theme(
    panel.border = element_blank(),
    panel.grid.major = element_blank(),
    panel.grid.minor = element_blank())+
  theme(axis.text = element_text(size = 14))+
  theme(axis.title.y = element_text(size = 14))+
  theme(axis.line = element_line(size = 0.5, colour = "black", linetype=1))+
  theme(legend.text=element_text(size=14))

stomata_plt


Created on 2021-11-19 by the reprex package (v2.0.0)
1 Like
Pell
November 19, 2021, 2:14pm
4
Thank you so much nirgrahamuk and @HanOostdijk - this is great help, exactly what I was after!
system
November 26, 2021, 2:15pm
5
This topic was automatically closed 7 days after the last reply. New replies are no longer allowed.