Background
Faceting is super useful in its ability to display information within and between groups. I would like to use the 'strip' area of the facets to aide in this utility.
I would like to display more information in the strip text area than just the group names on which the plot is faceted. For example, beneath the name of the facet on separate lines it would be nice to report some summary statistics per each of the facets.
Specifically, my objectives:
- Print data in the strip text which is being used in the plot.
- Print data in the strip text which is not being used in the plot, but exists in the data.
- String wrap long facet text (I've been able to achieve this).
Let's begin
In this contrived example, I've simulated some data with two variables thing and rating. There are 3 things (with very long strings on purpose) being evaluated on a 1-7 scale, 100 times. In the code below, I will have calculated the frequency distribution of ratings (n), the mean rating (avg) and the standard deviation of the rating (sd) by each of the things.
library(tidyverse)
set.seed(101)

# things being evaluated (with long strings)
things <- c(
    "Trust me, this string is totally going to have to get wrapped",
    "There's absolutely no way around having to wrap this string",
    "I'll bet my bottom dollar that this string will need to be wrapped"
)

# simulate the data
df <- tibble(
    thing = rep(things, times = 100),
    rating = sample(1:7, 300, TRUE)
)

# for each thing, calculate freq distribution, mean, sd
plot_me <-
    df %>%
    group_by(thing) %>%
    nest() %>%
    mutate(
        freq = map(data, function(x) x %>% group_by(rating) %>% tally()),
        avg  = map_dbl(data, ~mean(.x$rating)),
        sd   = map_dbl(data, ~sd(.x$rating))
    ) %>%
    unnest(freq)

plot_me
#> # A tibble: 21 x 5
#>    thing                                            avg    sd rating     n
#>    <chr>                                          <dbl> <dbl>  <int> <int>
#>  1 Trust me, this string is totally going to hav~  3.93  1.99      1    10
#>  2 Trust me, this string is totally going to hav~  3.93  1.99      2    19
#>  3 Trust me, this string is totally going to hav~  3.93  1.99      3    20
#>  4 Trust me, this string is totally going to hav~  3.93  1.99      4    15
#>  5 Trust me, this string is totally going to hav~  3.93  1.99      5     9
#>  6 Trust me, this string is totally going to hav~  3.93  1.99      6     9
#>  7 Trust me, this string is totally going to hav~  3.93  1.99      7    18
#>  8 There's absolutely no way around having to wr~  4.03  2.12      1    16
#>  9 There's absolutely no way around having to wr~  4.03  2.12      2    16
#> 10 There's absolutely no way around having to wr~  4.03  2.12      3    11
#> # ... with 11 more rows
Begin plotting
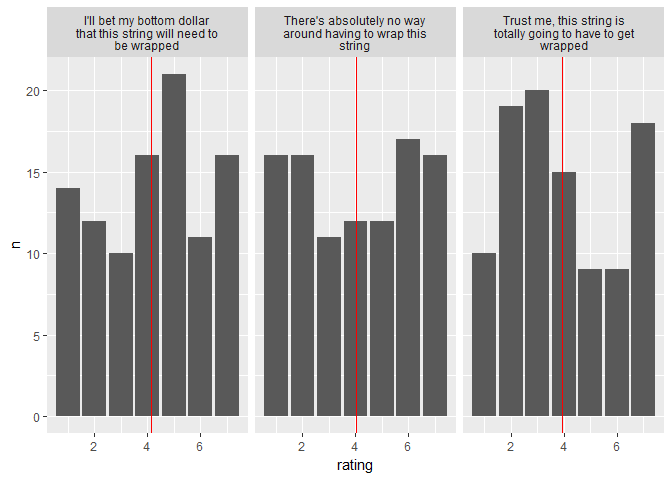
In this next code chunk, I will have plotted the frequency distribution as well as a vertical line representing the mean rating for each of the three members of thing. I have been able to use the labeller argument combined with label_wrap_gen() to wrap the text of the facets as I outlined in my three objectives. What I would like to do now is print the mean and sd of the ratings for each of the facets.
plot_me %>%
    ggplot(aes(x = rating, y = n)) +
    geom_col() +
    geom_vline(aes(xintercept = avg), color = "red") +
    facet_wrap(~thing, labeller = label_wrap_gen(30))

What I would like to do now is print the mean and sd of the ratings for each of the groups on new lines beneath the existing strip text (i.e."Mean: {avg}" and "SD: {sd}", on two lines). Please let me know if there are too many moving parts to contain this in a single post to the forum. Thank you in advance for the help and kudos to you if you actually read this whole thing.