I have a life stage prediction model which allocates points to each potential life stage according to a set of rules, and the life stage with the most points in total is deemed the winner. This unsupervised model works quite well in identifying whether sample customers are teenagers, single, in a couple, have young children, etc.
At the end of each model run I summarize the results to get the proportion of customers within each life stage. The model is run every three months, and without remediation the final proportions differ too much from the target proportions on each occasion. At the moment I use trial and error to re-balance the proportions by adding or subtracting a small number of points to each life stage to move borderline customers to another life stage category.
What I want is an automated means of specifying the points required to recalibrate the final proportions to match the target proportions with less pain (fewer iterations) than my manual approach. In essence, the reconciliation points (recon_pts) are an input to the model with the predicted life stage for each customer being the key output along with the corresponding proportions (model_pn). I want the model proportions to ultimately match the target proportions (target_pn).
An example will certainly help illustrate what I am after. Note, what follows are actual observed results but I don’t want a tool that uses or outputs these exact numbers but rather uses machine learning to more effectively recreate my trial and error approach.
Assuming a starting position of:
provided by:
ls_iter1 <- data.frame(
life_stage=c('CHD', 'TNG', 'TWS', 'SGL', 'CPL', 'YGF', 'PTF', 'OLF', 'ENR'),
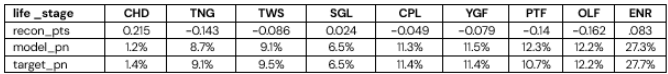
recon_pts=c(0.215, -0.143, -0.086, 0.024, -0.049, -0.079, -0.14, -0.162, 0.083),
model_pn=c(0.012, 0.087, 0.091, 0.065, 0.113, 0.115, 0.123, 0.122, 0.273),
target_pn=c(0.014, 0.091, 0.095, 0.065, 0.114, 0.114, 0.107, 0.122, 0.277))
The CHD life stage proportion is too low (1.2%) as it is below target (1.4%). At the other end of the scale, PTF is too high (12.3%) as it is above target (10.7%).
Under my manual approach I elect to increase the recon_pts for CHD from 0.215 to 0.22 so that I will get more customers in this life stage. At the same time I also reduce the points for PTF from -0.14 to -0.17 so fewer customers are assigned here.
I then end up with these results with all proportions being adjusted. The CHD proportions are closer to the target but still too low, PTF is now too low as the proportions have gone below target and everything else needs attention as well (sorry, as a newbie I can only embed one picture):
| life _stage | CHD | TNG | TWS | SGL | CPL | YGF | PTF | OLF | ENR |
| recon_pts | 0.22 | -0.143 | -0.086 | 0.024 |-0.049|-0.079| -0.17| -0.162|-0.083 |
| model_pn | 1.2% | 8.8% | 9.3% | 6.6% |11.5%|12.2%| 9.7%| 12.6%| 28.2%|
| target_pn | 1.4% | 9.1% | 9.5% | 6.5% |11.4%|11.4%|10.7%| 12.2%| 27.7%|
So, on the next iteration I might choose to increase recon_pts for CHD, increase the points for PTF and decrease the points for YFG. And on it goes in a painfully slow manner!
To me this sounds like an ideal candidate for machine learning where the process can learn how to adjust the recon_pts so that the model_pn eventually matches the target_pn for each life stage. Unfortunately I don't know enough about ML to know what R packages would be useful.
How could my problem be structured and coded in R please?