I'm testing out a new combination of technologies and have had partial success. I'm trying to create a simple dashboard that allows a user to make a few interactive selections and see results based on a fairly large underlying dataset. This will be for users external to my organization, and in fact needs to outlive the organization, so the goal is to require as little in terms of infrastructure, hosting, and maintenance as possible -- which is why I'm trying to avoid the classic Shiny solution here. The task at hand is also simple enough that the capabilities of Shiny are more than seem necessary.
I got some great ideas from talking with people at Posit conf 2024 about ways to approach this (including ShinyLive, QuartoLive, and Posit Connect Cloud). The one that seems to best meet my needs, if I can get it working well enough, is Quarto + OJS + DuckDB. DuckDB allows for querying the data quickly based just on a parquet file. OJS provides the simple user interactivity in the browser. Quarto brings everything together into a dashboard format. The final result should require nothing more than standard website hosting.
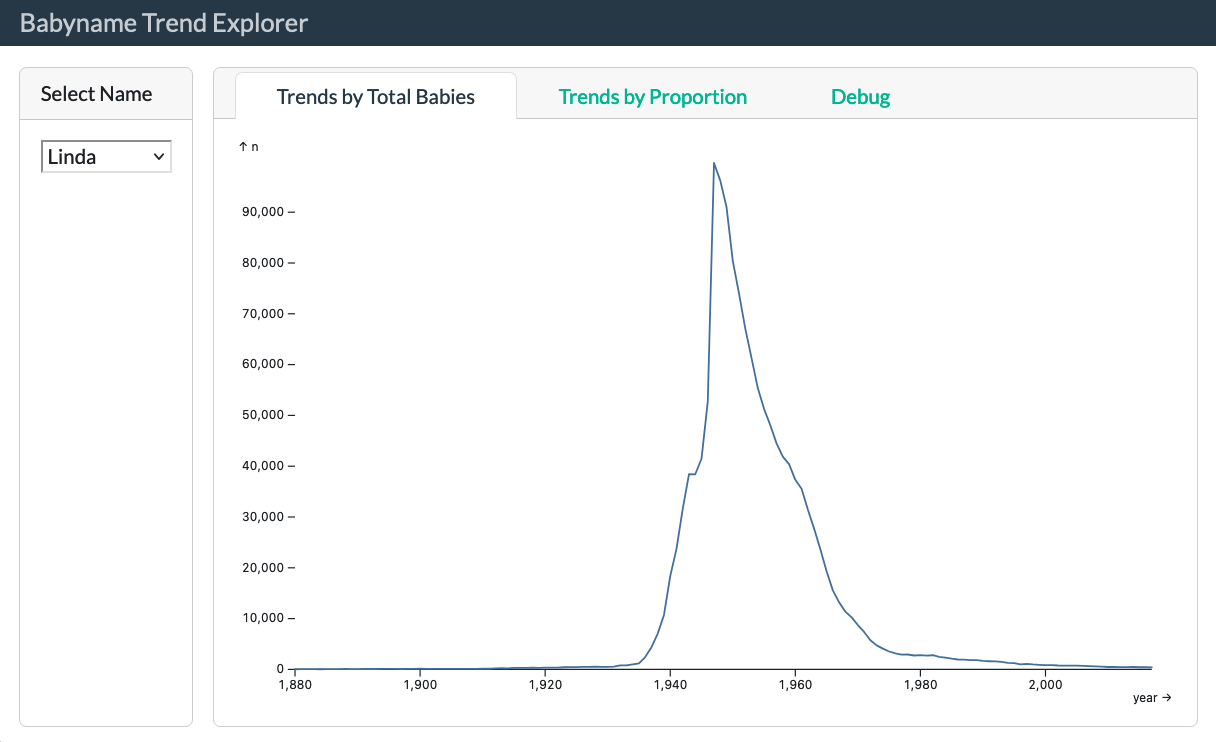
In the spirit of a reproducible example, I've made a dashboard similar to what I'm aiming for using the babynames dataset. I've gotten it to proof of concept level (though I haven't yet tried hosting it). It allows a user to select a baby name and see a plot of the trend over time. It's very fast and doesn't ever load all the data into memory.
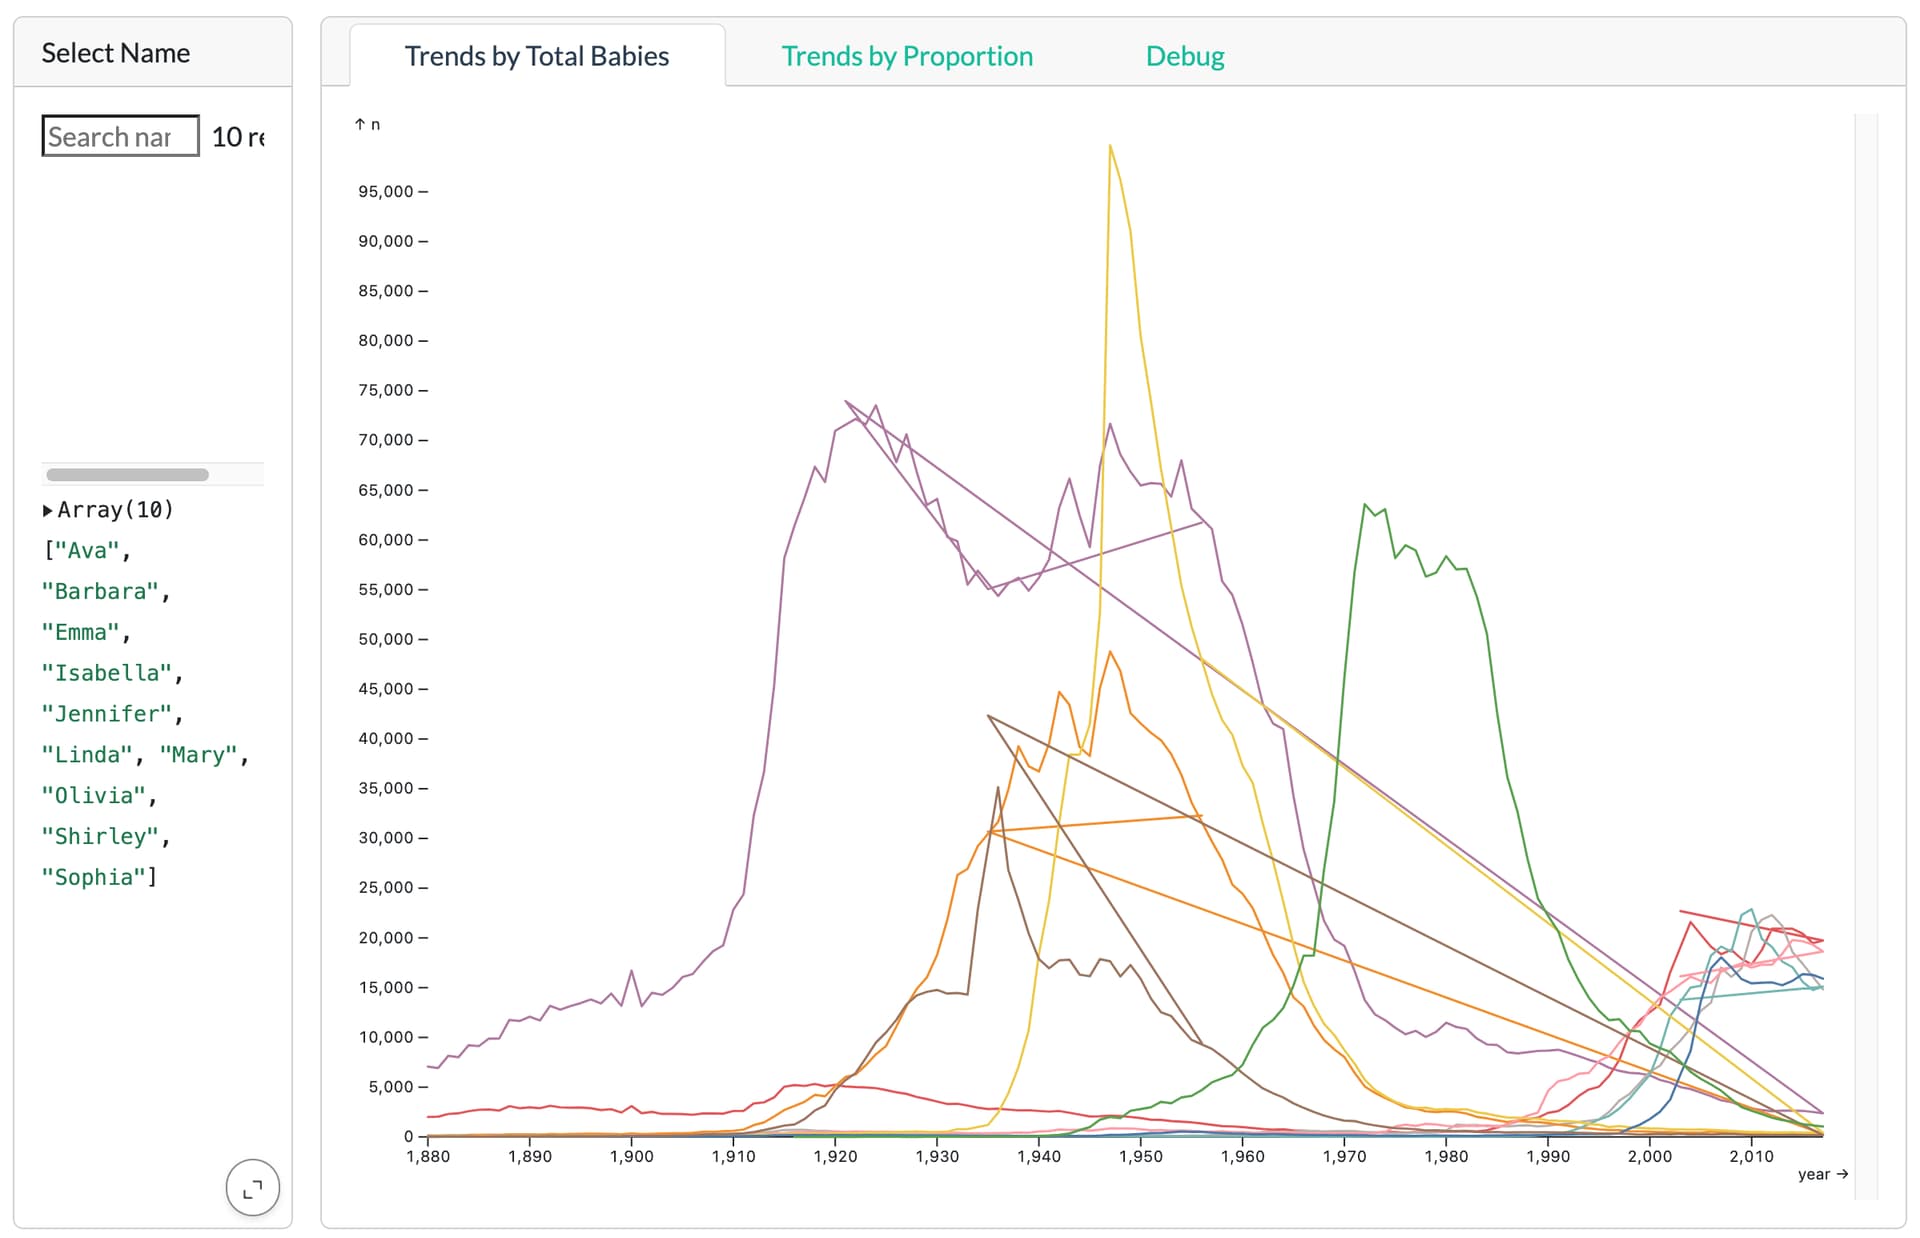
The whole ~2 million row baby names dataset is saved as a parquet file (6.5 Mb). DuckDB is used to treat this like a database table. Currently, I'm only allowing the user to choose from 10 names, due to limitations I'll describe below, but the data is there to support all 97,000 names.
So it's encouraging that this approach is workable, but as I tried to add a few more things to make it good enough for my purposes, I ran into some problems.
Biggest problem
I think this problem comes down to needing to include some non-OJS javascript that is responsive to user inputs, but maybe there are other ways to accomplish the same goal. I originally created this dashboard using Arquero and attaching all the data instead of using DuckDB. This worked and had nice interactive filtering features, but it understandably makes the resulting html file really big. Since I want to use this approach with an even larger dataset, I had to move away from Arquero (which as far as I can tell, can't operate using a DuckDB query). There are two things I could do with Arquero that I can't figure out how to do now. They relate to constructing the right query based on user inputs when it gets any more complicated that filtering on a single value.
Specifically, what I'd like to do is have a null value as the default on the select list, such that if that is chosen all names are included. This just means that I need to check if this value is null, and if so, construct the query without the WHERE clause. If I could use vanilla javascript if/else logic that is responsive to the selected value, it would be easy. I know there's a way to include JS in a html chunk in Quarto, but how can I do this in a responsive way?
Other problems
-
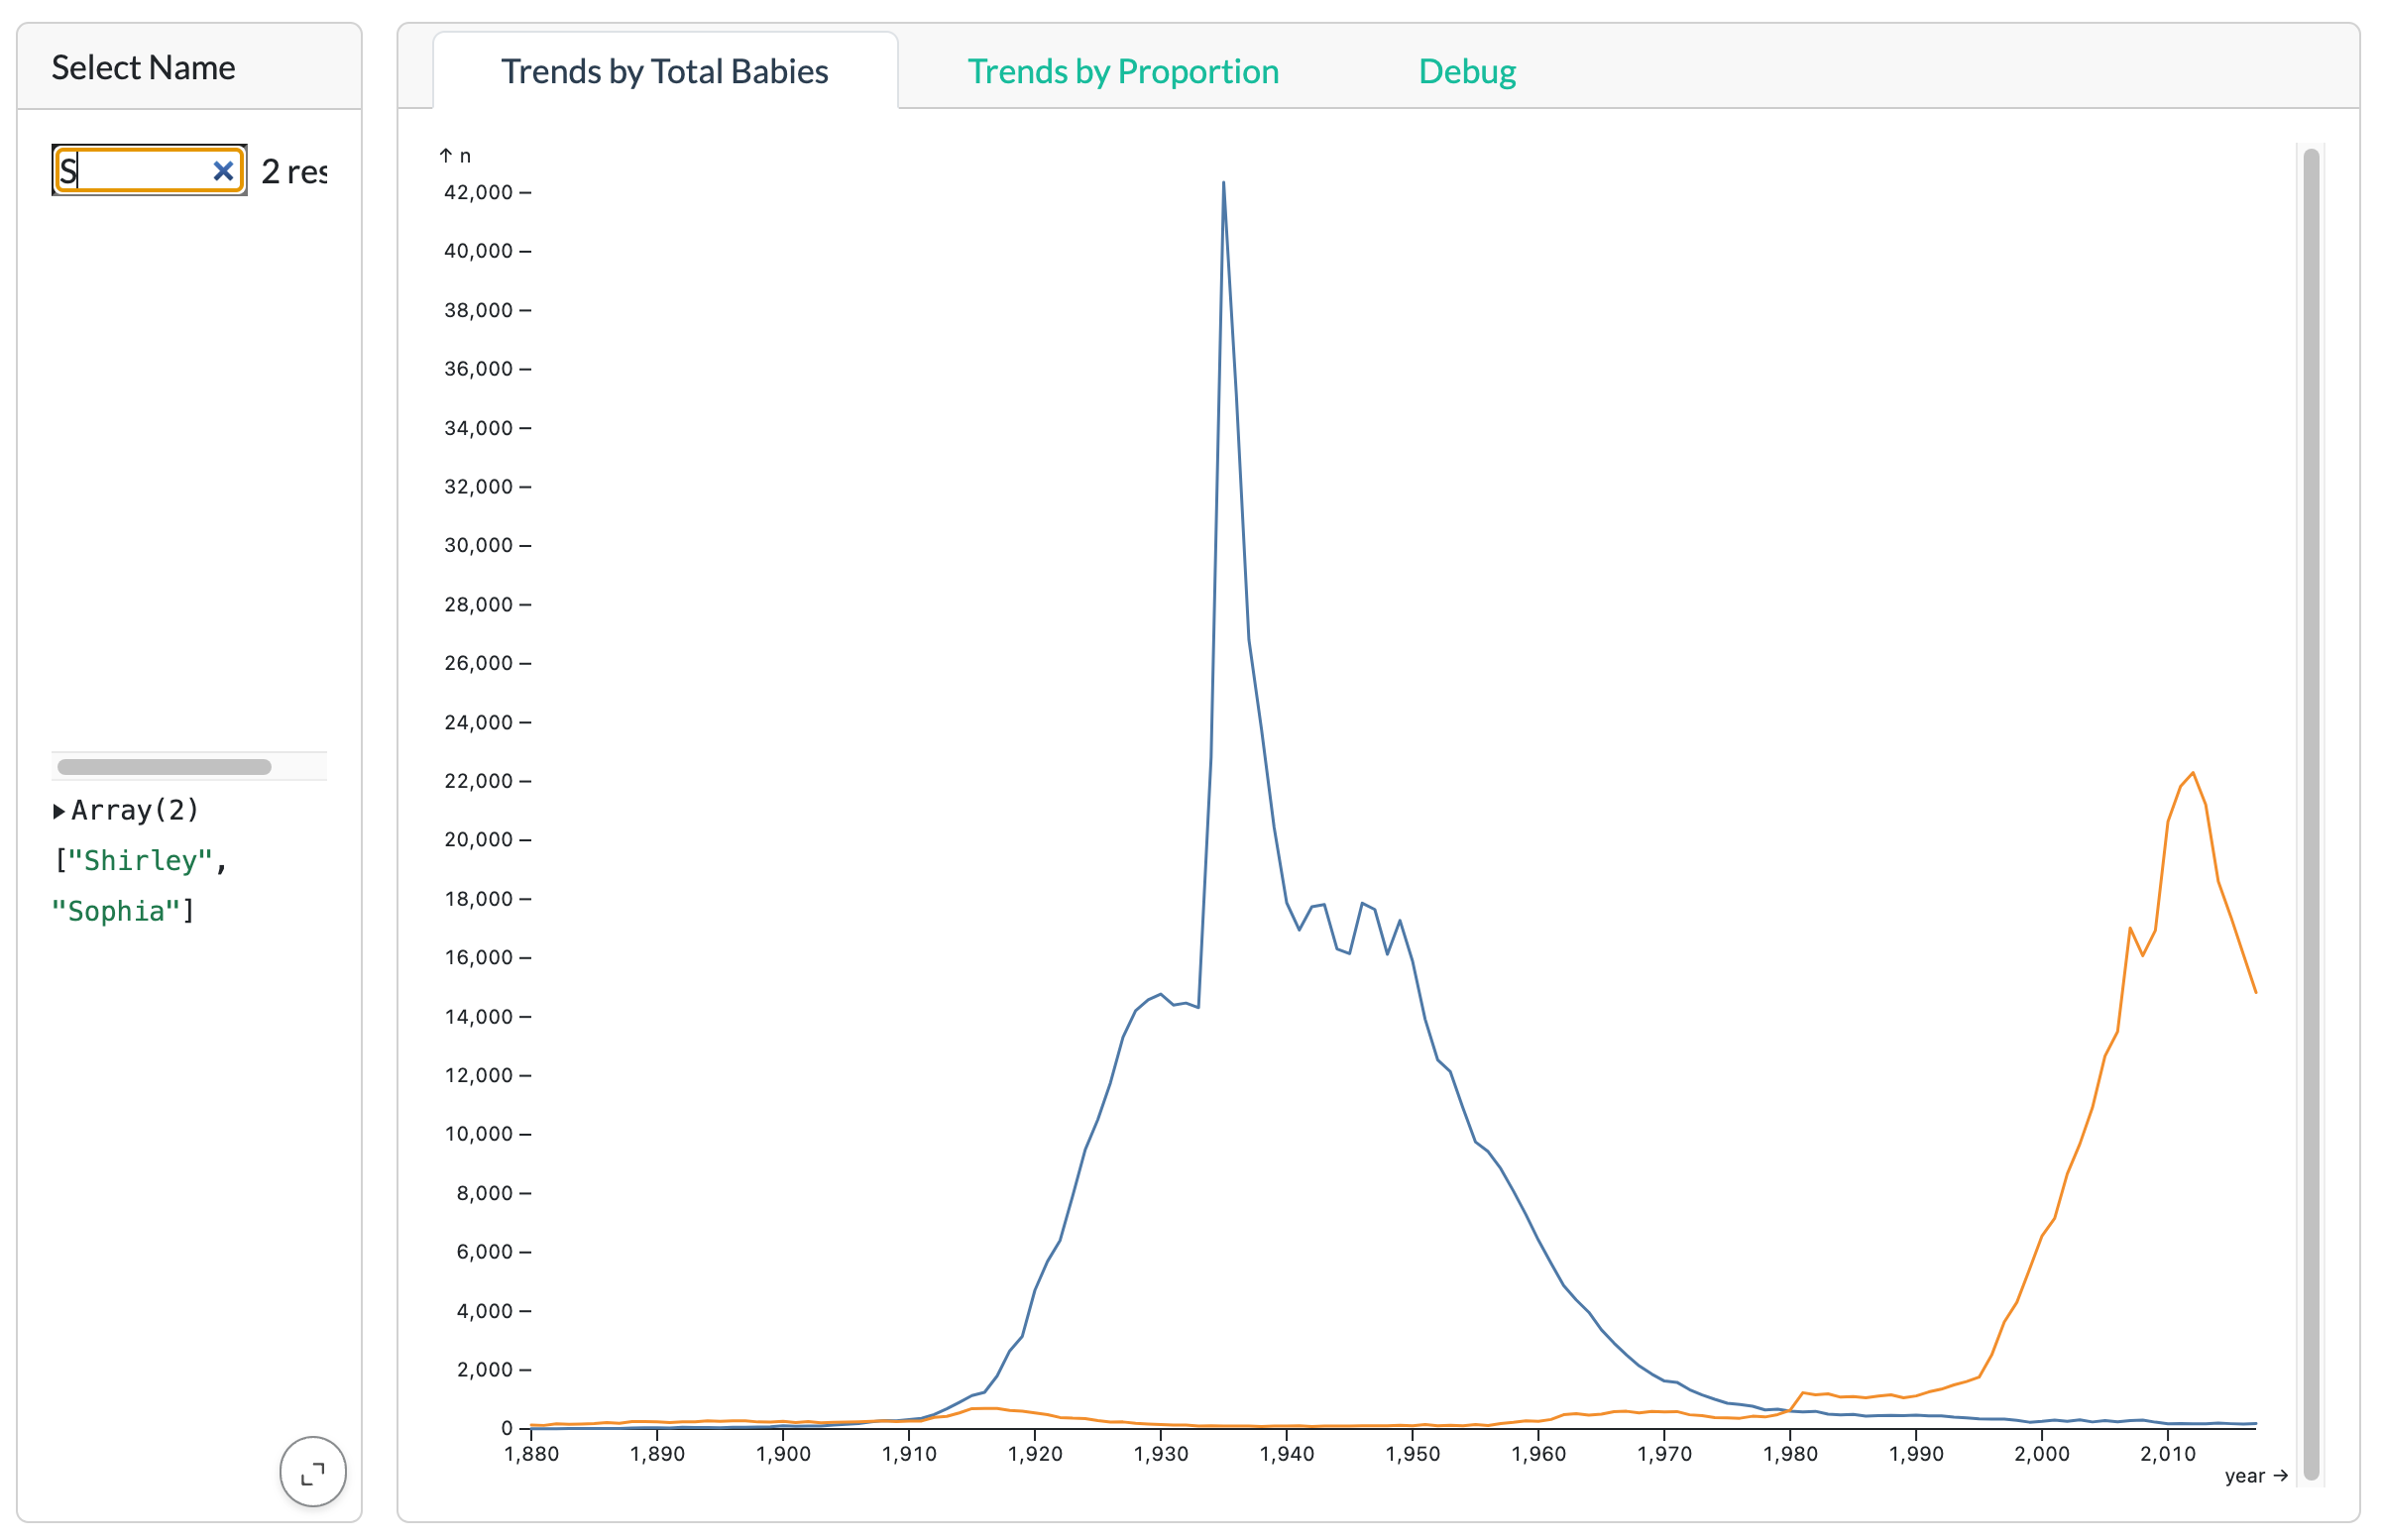
I'd like to allow users to choose any name in the dataset to view, which means a searchable/type-ahead style input, rather than one where I enumerate all the values. Ideally this would also allow for multi-select. Clearly these components are possible with javascript, but is there a way to make them OJS inputs?
-
The existing code has a plot of total births and then in the second tab, there should be one with births as a proportion of population. I've copied identical code and changed the y value from n to prop, but the plot never shows up or indicates any kind of error. I've tried all sort of combinations to try to diagnose the problem and under no circumstance can I have two plots appear in this dashboard. This seems really bizarre, and I wonder if there might be some combination of the Quarto dashboard layout and ojs causing an issue here?
-
I've tried and failed to remove the comma from the year on the x-axis. Surely an easy fix but for some reason the solution I have in the code from an extremely similar example isn't working. Maybe the "right" answer is to make this a typed dataset where year is a date variable, which I'm guessing would require vanilla javascript that would apply to every query result.
I hope this Quarto/OJS/DuckDB combination might be useful to other people as well, and if I can get these last issues sorted out I'll update my repo and make it available as an example of how this can work. I appreciate any help people can provide! Dipping a toe in the javascript realm is a bit daunting for an R user : )
Cloning this Github repo should allow anyone to render this dashboard locally. If you change line 26 to use names_query2 instead of names_query1, it shows how the plot is already set up to show the trends of multiple names (but then is ignoring the user selection). I've included the screenshot of the dashboard below just to make it clear what it does. The Debug tab shows the constructed SQL query which I've found helpful in understanding what's going on.