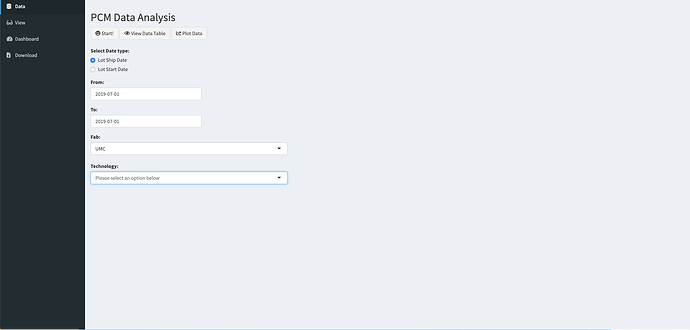
I want a Shiny dashboard to query mySQL database according to reactive filters. This is also my first time using pool package.
I'm having trouble with reactivity of this dashboard.
##################################################################
# Loading required packages
##################################################################
library(shiny)
library(shinydashboard)
library(shinyWidgets)
library(tidyverse)

##################################################################
# Establishing connection with database
##################################################################
library(pool)

# Connect to database
pool <- dbPool(
  drv = RMySQL::MySQL(),
  dbname = XXX
  host = "localhost",
  user = "root",
  password = XXX
)


##################################################################
# Function to load data
##################################################################
loadData <- function(fields,
                     table,
                     sortCol = '',
                     WhereCls = '') {
  # If there is NO WHERE clause
  if (WhereCls == '')
    query <- sprintf("SELECT DISTINCT %s FROM %s", fields, table)
  else
    query <-
      sprintf("SELECT DISTINCT %s FROM %s WHERE %s", fields, table, whereCls)

  # retrieve query result and store in dataDB
  dataDB <- dbGetQuery(pool, query)

  # Arrange datatable by a column and return datatable
  if (sortCol != "")
    dataDB[order(dataDB[sortCol]), ]
  else
    dataDB
}
##################################################################
##################################################################


##################################################################
# UI Component
##################################################################
header <- dashboardHeader(
  title = "XXX",
  titleWidth = 215
)

sidebar <- dashboardSidebar(
  sidebarMenu(
    id = "tabs",
    menuItem("Data", tabName = "data_analysis", icon = icon("database")),
    menuItem("View", tabName = "view_analysis", icon = icon("glasses")),
    menuItem(
      "Dashboard",
      tabName = "dashboard",
      icon = icon("dashboard")
    ),
    menuItem(
      "Download",
      tabName = "download",
      icon = icon("file-download")
    )
  )
)

body <- dashboardBody(

  tabItems(
    tabItem(
      tabName = "data_analysis",

      h2("PCM Data Analysis"),

      fluidRow(
        column(5,
               actionButton(
                 "start_analysis",
                 "Start!",
                 icon = icon("grin-stars"),
                 width = NULL
               ),

               actionButton(
                 "viewdata",
                 "View Data Table",
                 icon = icon("eye"),
                 width = NULL),

               actionButton(
                 "plotdata",
                 "Plot Data",
                 icon = icon("chart-line"),
                 width = NULL)
        )
      ),

      br(),

      fluidRow(
        column(12,


               radioButtons(
                 "DateFormat",
                 "Select Date type:",
                 c("Lot Ship Date", "Lot Start Date"),
                 width = NULL)
        )
      ),

      fluidRow(

        column(12,

               dateInput(inputId = "from_date", label =  "From:",
                         width = NULL),
               dateInput(inputId = "to_date", label =  "To:",
                         width = NULL)
        )
      ),

      fluidRow(

        column(4,
               uiOutput("fab_ui", width = NULL),
               # Add image here
               uiOutput("technology_ui", width = NULL)
        ),
        column(4,
               uiOutput("route_ui"),
               uiOutput("product_ui")
        ),
        column(4,
               uiOutput("lot_ui"),
               uiOutput("test_ui")
        )
      )

    ),


    tabItem(
      tabName = "view_analysis",
      h2("Data table viewer"),
      fluidRow(DT::dataTableOutput("table"))
    ),
    tabItem(tabName = "dashboard",

            fluidRow(plotOutput("plots"))),
    tabItem(
      tabName = "download",
      h2("Download data and/or report"),
      fluidRow(
        column(
          3,
          offset = 1,
          downloadButton("downloadcsv", "Download CSV File", icon = icon("table"))
        ),
        column(
          3,
          offset = 1,
          downloadButton("downloadpdf", "Download PDF File", icon = icon("file-pdf"))
        )
      )
    )
  )
)

# UI
ui <- dashboardPage(skin = "blue", header = header,
                    sidebar = sidebar,
                    body = body)


server <- function(input, output, session) {


  data1_reactive <- reactive({dbGetQuery(pool,
                               paste("select distinct li.Foundry,
                                     li.Process,li.Route, li.Product,
                                     li.AllegroLot, li.Wafer, li.FoundryLot,
                                     li.LotStartDate, li.LotShipDate, r.tname,
                                     r.units, r.ll, r.hl, r.Site, r.Result,
                                     wy.Yield from v_et_lotinfo li inner join v_et_results r on li.splitlot_id=r.splitlot_id inner join v_wt_waferyield wy on (li.AllegroLot=wy.Lot and li.Wafer=wy.wafer) where
                                     li.LotShipDate >", input$from_date, "and li.LotShipDate <",
                                    input$to_date))})


  # Foundry ########################################################
  foundry <- loadData(fields = "Foundry",
                      table = "v_et_lotinfo",
                      sortCol = "Foundry")
  ##################################################################


  # Render UI ######################################################
  output$fab_ui <- renderUI({
    selectizeInput(
      "fab",
      "Fab:",
      foundry,
      options = list(
        placeholder = 'Please select an option below',
        onInitialize = I('function() { this.setValue(""); }')
      ),
      width = '100%',
      multiple = FALSE
    )
  })

  data1 <- reactive({data1_reactive() %>% filter(Foundry == input$fab)})

  output$technology_ui <- renderUI({

    selectizeInput(
      "technology",
      "Technology:",
      choices = as.vector(unique(data1()$Process)),
      options = list(
        placeholder = 'Please select an option below',
        onInitialize = I('function() { this.setValue(""); }')
      ),
      width = '100%',
      multiple = FALSE
    )
  })

}

shinyApp(ui, server)
It seems like loadData works since inside Fab selectizeInput, I see my two options. However, the problem is with Technology. Inside selectizeInput, I have choices = as.vector(unique(data1()$Process)), but on the dashboard, I don't see any options in Technology.
I'd love some help on whether the data1 reactive object is coded correctly!
Thank you so much ![]()
