Using character values with geom_errorbar() - no error message?

When using data with character values in geom_errorbar, there is no error message - is this a purpose feature or a bug?

Here is a MRE for this problem, you can see the y-axis for the plot is unordered and no error message is flagged:

library(ggplot2)

temp <- data.frame(contrast = c("set 1", "set 2"),
                   estimate = c("-2000", "2000"),
                   LCI = c("10","-10"),
                   UCI = c("50", "50")
                   )

# Plot
ggplot(temp, aes(x = contrast, y = estimate)) +
  geom_point() +
  geom_errorbar(aes(ymin = LCI, ymax = UCI), width = 0.2) 

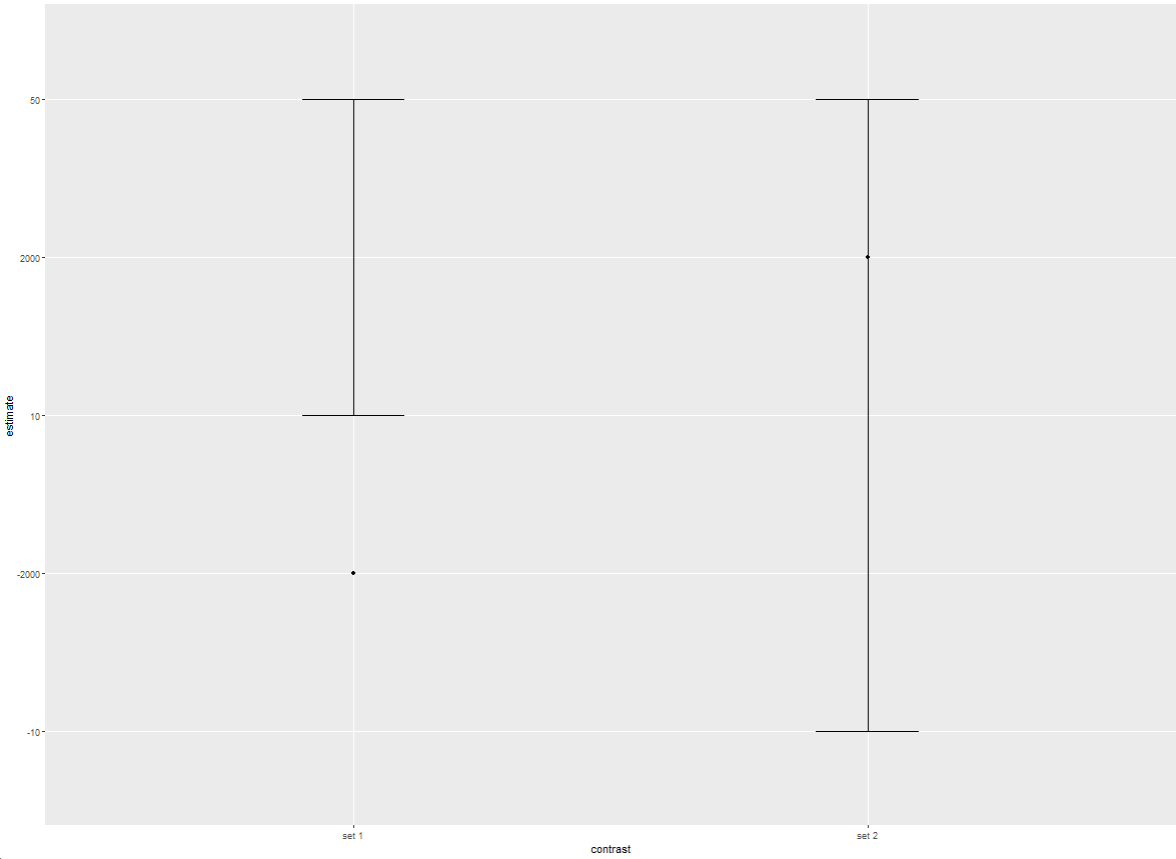
I tried your code and am getting points and error bars.

Why are you using character values in a plot format that is intended for numeric data? Character error bars seem meaningless to me. It is like calculating the mean of c("A", "B", "C", "D", "E")

What happens if you just run

ggplot(temp, aes(x = contrast, y = estimate)) +
  geom_point()

I'd say this is intentional. "Internally, ggplot2 handles discrete scales by mapping each category to an integer value and then drawing the geom at the corresponding coordinate location."

Ah, thanks. Then I assume my results probably make sense and we still don't know why @ rosiecooper is not getting the points.

Oh, but they they are. The points are just rather small. I see them.

Blast it, I originally thought I saw one and then decided I needed to clean my computer screen because I later lost it.

So now I'm lost. Exactly what is @ rosiecooper's problem?

It's easy to look at a discrete y axis where the labels are numbers and nor realize that they are sorted alphabetically in stead of numerically because they are character strings in stead of integers.