Use One Filter Across Tabs in Shiny App

I have designed a Shiny app to have multiple navbarMenus, each consisting of its own tabPanels.
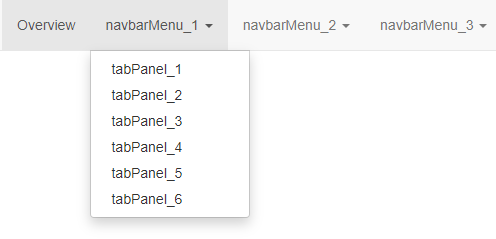
image

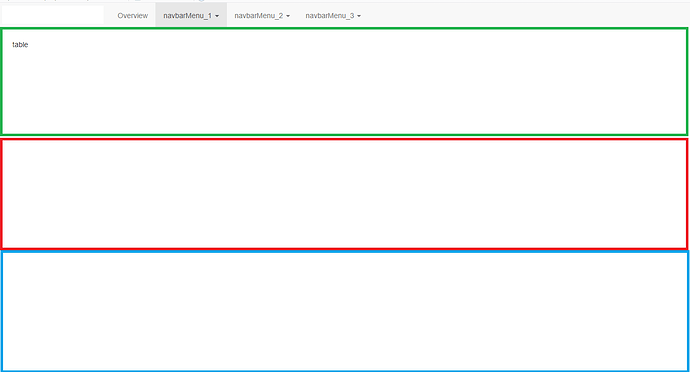
Within a given navbarMenu (e.g. navbarMenu_1), the tabPanels each have multiple elements. In the example below, these 3 colored elements would be housed under navbarMenu_1 --> tabPanel_1.

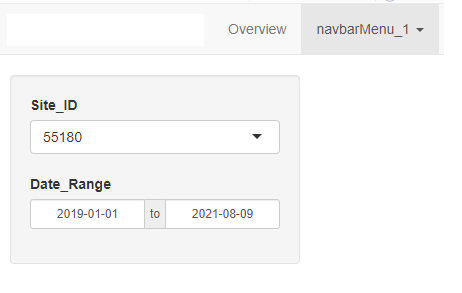
Currently, the data displayed within the elements is controlled by a filter that limits the rows displayed.
image

In its current state, each tabPanel page has its own filter, which means that a user's selection from one page is not carried over to the other. Below is an example of the how the elements and filters are built within the app.R file. The takeaway is that within a given navbarMenu_* --> tabPanel_*, the inputId for selectInput and dateRangeInput are all assigned a number to indicate which tabPanel they are applied to:

ui <- navbarPage("My Dashbaord",
                 tabPanel("Overview",
                          fluidPage("table")
                 ),
                 navbarMenu("navbarMenu_1",
                            tabPanel("tabPanel_1",
                                     sidebarLayout(
                                       sidebarPanel(
                                         selectInput(inputId = "site_id_1",
                                                     label = "Site_ID",
                                                     choices = list_of_sites,
                                                     selected = "55180",
                                                     multiple = FALSE,
                                                     width = "100%"),
                                         dateRangeInput(inputId = "date_range_1",
                                                        label = "Date_Range",
                                                        start = start_date,
                                                        end = end_date,
                                                        min = start_date,
                                                        max = end_date,
                                                        format = "yyyy-mm-dd",
                                                        startview = "month",
                                                        weekstart = 0,
                                                        separator = " to ",
                                                        width = "100%",
                                                        autoclose = TRUE),
                                         width = 2
                                       ),
                                       mainPanel(
                                         dataTableOutput("plot_table_1"))
                                     )
                            ),
                            tabPanel("tabPanel_2",                                     
                                     sidebarLayout(
                                       sidebarPanel(
                                         selectInput(inputId = "site_id_2",
                                                     label = "Site_ID",
                                                     choices = list_of_sites,
                                                     selected = "55180",
                                                     multiple = FALSE,
                                                     width = "100%"),
                                         dateRangeInput(inputId = "date_range_2",
                                                        label = "Date_Range",
                                                        start = start_date,
                                                        end = end_date,
                                                        min = start_date,
                                                        max = end_date,
                                                        format = "yyyy-mm-dd",
                                                        startview = "month",
                                                        weekstart = 0,
                                                        separator = " to ",
                                                        width = "100%",
                                                        autoclose = TRUE),
                                         width = 2
                                       ),
                                       mainPanel(
                                         dataTableOutput("plot_table_2"))
                                     )
                            )

This implementation is a common complaint among my users, as they want their selections carried over as they explore the elements within the app.

Is it possible to implement a single filter that is shared across these multiple tabPanel pages? Is there a more appropriate way to organize my user interface that I should look into?
The answer to the question required the app's UI to be restructured. Below is the solution that allows address_filter, site_filter, and date_range_filter to be applied to the various table_* elements created in the server section:

ui <- 
  navbarPage(
    title = "My Dashboard",
    tabPanel("Overall",
             fluidPage("table")
             ),
    tabPanel(
      "Tab_1",
      fluidPage(
        sidebarLayout(
          sidebarPanel(
            checkboxInput(
              inputId = "address_filter", 
              label = "Filter by Address", 
              value = FALSE
              ),
            selectInput(
              inputId = "site_filter",
              label = "Site ID",
              choices = c("", unique(site_list$Site_ID)),
              selected = NULL,
              multiple = TRUE,
              width = "100%"
              ),
            dateRangeInput(
              inputId = "date_range_filter",
              label = "Date_Range",
              start = start_date,
              end = end_date,
              min = start_date,
              max = end_date,
              format = "yyyy-mm-dd",
              startview = "month",
              weekstart = 0,
              separator = " to ",
              width = "100%",
              autoclose = TRUE
              ),
            width = 2
            ),
          mainPanel(
            tabsetPanel(
              tabPanel(
                "Overview",
                mainPanel(
                  dataTableOutput("table_1")
                  )
                ),
              tabPanel(
                "KPI_1",
                fluidPage("table")
                ),
              tabPanel(
                "KPI_2",
                mainPanel(
                  dataTableOutput("table_2")
                  )
                ),
              tabPanel(
                "KPI_3",
                mainPanel(
                  dataTableOutput("table_3")
                  )
                ),
              tabPanel(
                "KPI_4",
                fluidPage("table")
                ),
              tabPanel(
                "KPI_5",
                fluidPage("table")
                )
              )
            )
          )
        )
      )
    )
1 Like

This topic was automatically closed 7 days after the last reply. New replies are no longer allowed.

If you have a query related to it or one of the replies, start a new topic and refer back with a link.