Well in that case it's obvious: just remove the quotes 
But of course this is not what you want, if you remove the quotes, you will actually evaluate train[[v]] and get a (big) numeric vector, which is not at all informative. No, what you want to display, as far as I can tell, is the name of the variable being plotted, that is, the content of v.
library(hexbin)
train <- data.frame(X1 = rnorm(1000, mean = 1),
X2 = rnorm(1000, mean = 5),
Y = rnorm(1000, mean = 50))
for(i in 1:2){
v <- paste("X",i,sep="")
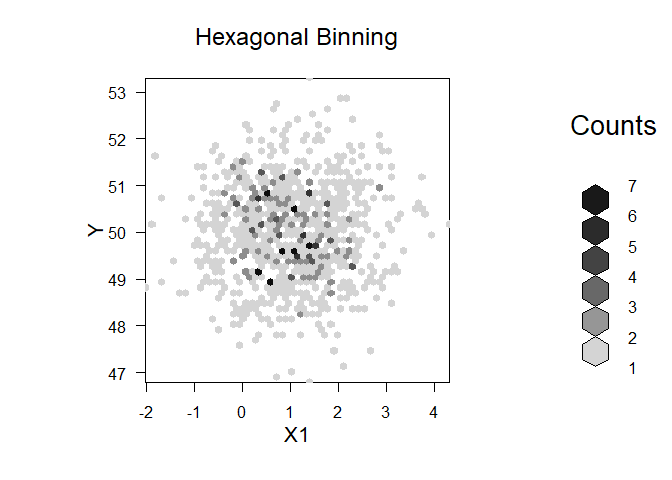
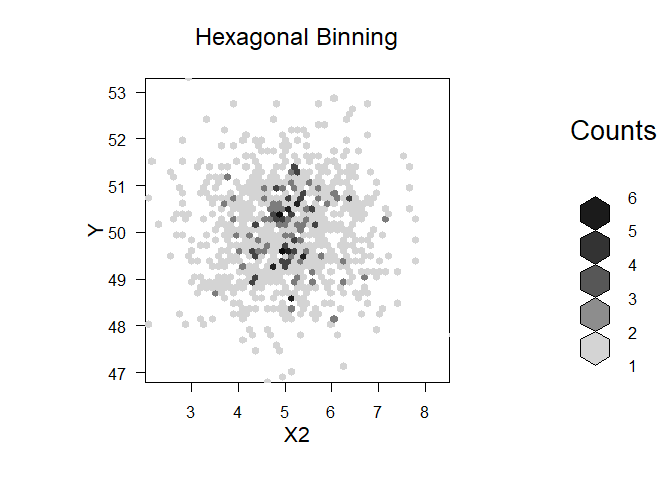
bin<-hexbin(train[[v]], train$Y, xbins=50)
plot(bin, main="Hexagonal Binning",xlab=v,ylab="Y")
}
Created on 2022-12-15 by the reprex package (v2.0.1)
To create this example, I changed 4 things:
- added a
Y column in the data frame, otherwise you can't use it
- reduced the number of X from 5 to 2, just because 5 plots felt too much in this thread for an example
- changed the definition of
X1 and X2: trying to define 50 bins from 50 points might be a problem, giving this "invalid number of intervals" error. So I went to ?hexbin and copy-pasted from their example
- removed the
par(mfrow) which does not do what you might want it to do.
For that last point, it's actually a bit complicated. There are two systems of plots in R, the "base" system and the "grid" system. Base plots are controlled by par(), not grid plots. This hexbin plot is built using the grid system.
The base system was historically the first one, it's great, but not very flexible. The grid system is very powerful and most modern plotting on R is based on it, but it's quite complicated, typically as a standard user you don't want to interact with it directly. One interesting feature of the grid system is that you can save a whole grid plot in an R object and plot it later, which is not possible with base graphics.
So, ideally, if you want to plot all your hexbins side-by-side, I would suggest you save them in a variable:
plots_saved <- list()

for(i in 1:2){
  v <- paste("X",i,sep="")
  bin<-hexbin(train[[v]], train$Y, xbins=50)
  plots_saved[[v]] <- plot(bin, main="Hexagonal Binning",xlab=v,ylab="Y")
}

str(plots_saved,max.level = 2)
#> List of 2
#>  $ X1:List of 2
#>   ..$ plot.vp  :Formal class 'hexVP' [package "hexbin"] with 9 slots
#>   ..$ legend.vp:List of 33
#>   .. ..- attr(*, "class")= chr "viewport"
#>  $ X2:List of 2
#>   ..$ plot.vp  :Formal class 'hexVP' [package "hexbin"] with 9 slots
#>   ..$ legend.vp:List of 33
#>   .. ..- attr(*, "class")= chr "viewport"
and then plot the results with a function like grid.arrange().
But this is not possible here! I don't fully understand what the plot.hexbin() function is returning, it appears to be "viewports" from the grid system, I don't know enough to figure out how to plot them, and not fully sure it's possible.
I can suggest two solutions:
1 save plots as you go
dir.create("export")

for(i in 1:2){
  v <- paste("X",i,sep="")
  bin<-hexbin(train[[v]], train$Y, xbins=50)
  png(paste0("export/", v, ".png"))
    plot(bin, main="Hexagonal Binning",xlab=v,ylab="Y")
  dev.off()
}
with this, we create a directory "export", and save the plots as soon as we generate them.
2 use a different package
Not saying that the {hexbin} package is necessarily bad, but I find it easier to work with {ggplot2}. It's a plotting package (developed using the grid system, but no need to interact directly with it) which has had a lot of success in recent years, and you can find a LOT of resources online. So that does require learning yet another approach, but seeing as it's ubiquitous nowadays, it's probably worth learning anyway. A good start is here.
Using it, you can pretty easily get what you want:
library(ggplot2)
library(tidyr)

train_long <- pivot_longer(train,
                           cols = starts_with("X"),
                           names_to = "X_index",
                           values_to = "X_value")

ggplot(train_long) +
  geom_hex(aes(x = X_value, y = Y)) +
  facet_wrap(~ X_index)