Thanks for the answer.
I'll try to do my best giving code and sample of data.
For the polygons of the regions I use a file downloaded from this site: https://france-geojson.gregoiredavid.fr/
for the sample, i'll give the sample in r code
if (!require("leaflet")) {
install.packages("leaflet")
library('leaflet')
}
if (!require("htmlwidgets")) {
install.packages("htmlwidgets")
library(htmlwidgets)
}
if (!require("dplyr")) {
install.packages("dplyr")
library(dplyr)
}
if (!require("rgdal")) {
install.packages("rgdal")
library(rgdal)
library(sp)
}
if (!require("rjson")) {
install.packages("rjson")
library(rjson)
}
if (!require("leaflet.extras")) {
install.packages("leaflet.extras")
library(leaflet.extras)
}
samplee <- tibble::tribble(
~Latitude_ville, ~Longitude_ville, ~n,
43.8804, -1.1552, 1,
43.4617, 1.9959, 1,
48.881, 2.5507, 1,
45.6339, 5.5641, 1,
49.6653, 1.9333, 1,
47.2379, 6.8002, 1,
48.8727631, 2.272776, 6,
48.9582, 4.315, 1,
49.2617, 5.9566, 1,
47.8352, 0.0614, 1,
43.6813, 7.1787, 3,
48.7405, -0.5645, 3,
43.1249, 5.9306, 8,
47.6219, 7.1203, 1,
46.0441, 6.2986, 1,
46.0985, 4.3438, 1,
48.7978, 2.2535, 1,
49.4662, 5.9271, 1,
45.9048, 4.4176, 1,
46.368, 2.5488, 2,
43.442, 3.7802, 1,
43.3688, 5.6465, 1,
48.2185, -3.3075, 1,
48.2916, 4.1233, 1,
48.9977, 2.0939, 1,
43.8925, -0.4844, 5,
48.8735, 2.7083, 2,
43.5299, 6.9262, 2,
44.1288, 0.3414, 1,
48.6889, 6.1709, 4,
49.4662, 5.9271, 1,
47.7765, 7.3585, 1,
48.2018, 7.2923, 1,
48.8696, 2.4255, 1,
47.8127, 7.3166, 3,
47.6496, 6.8381, 3,
46.0888, 4.0578, 2,
49.0308, 2.2245, 2,
48.7091, 2.3887, 1,
48.8956, 2.5694, 1,
48.6291, -2.057, 1,
48.4981, 4.9189, 1,
43.2700089, 5.3816693, 5,
49.0662, 2.0647, 4,
48.8093, 2.3873, 1,
50.3218, 3.5377, 1,
47.5148, 7.007, 1,
48.8456, 7.8308, 5,
45.6576, 6.3456, 1,
50.6757, 3.1294, 1,
44.9946, -0.4223, 3,
47.26, 6.0285, 6,
48.6153, -3.4872, 1,
45.7179, 0.1927, 4,
47.8802, -2.8392, 1,
50.529, 2.6406, 3,
44.6541, -1.174, 1,
45.4018, 4.3704, 2,
48.0242, -1.7465, 1,
50.7524, 3.1576, 1,
47.1523, 4.9305, 1,
43.3899, 0.0476, 1,
50.6754, 3.1544, 1,
48.1591, -1.6809, 3,
45.8397, 4.9972, 1,
46.7659, 4.4476, 1,
45.9041, -0.9586, 1,
48.7769, 7.8943, 1,
48.6274, 2.5541, 5,
49.7517, 2.1461, 1,
44.9045, 1.1981, 2,
47.6024, 6.8574, 1,
48.8966, 2.2108, 1,
48.7116, 2.2296, 1,
48.9, -1.526, 1,
49.0113, 2.0326, 1,
48.1275, -1.9619, 1,
43.6169, 1.0884, 2,
50.4152, 2.9096, 1,
50.2119, 3.0607, 1,
50.9285, 1.8172, 3,
45.5534, 2.3033, 1,
50.6822, 3.2371, 2,
46.7698, 0.494, 1,
44.9001, 5.0143, 1,
48.6913, 2.5338, 1,
44.7654, -0.4768, 1,
47.732, 0.5812, 1,
45.7988, 4.8532, 2,
43.1702, -0.5928, 1,
49.0983, 2.4979, 1,
43.9192, 5.0582, 1,
49.2633, 6.0875, 1,
45.4781, 4.4269, 1,
48.987, 2.4602, 1,
43.2956, 3.4882, 2,
48.8635, 2.4501, 2,
48.085, -1.8417, 1,
48.4671, -2.6852, 1,
46.789, 4.8438, 5,
47.5148, 7.007, 1,
50.1095, 1.826, 3,
47.0421, 3.1425, 1,
48.7091, 2.3887, 1,
48.0665, 7.2793, 1,
48.0749, -0.8563, 1,
45.3388, 5.0419, 1,
43.9275, 4.265, 1,
44.8621, -0.0718, 1,
48.8447, 2.2082, 1,
47.5661, -0.1136, 1,
50.5117, 2.1259, 1,
43.732, 4.2334, 1,
48.9651, 1.8728, 2,
50.4894, 2.9558, 2,
47.626, 1.32, 1,
48.1885, 5.8898, 1,
45.2438, 4.2191, 1,
48.9671, 2.557, 3,
51.0346, 2.3386, 6
)
head(samplee)
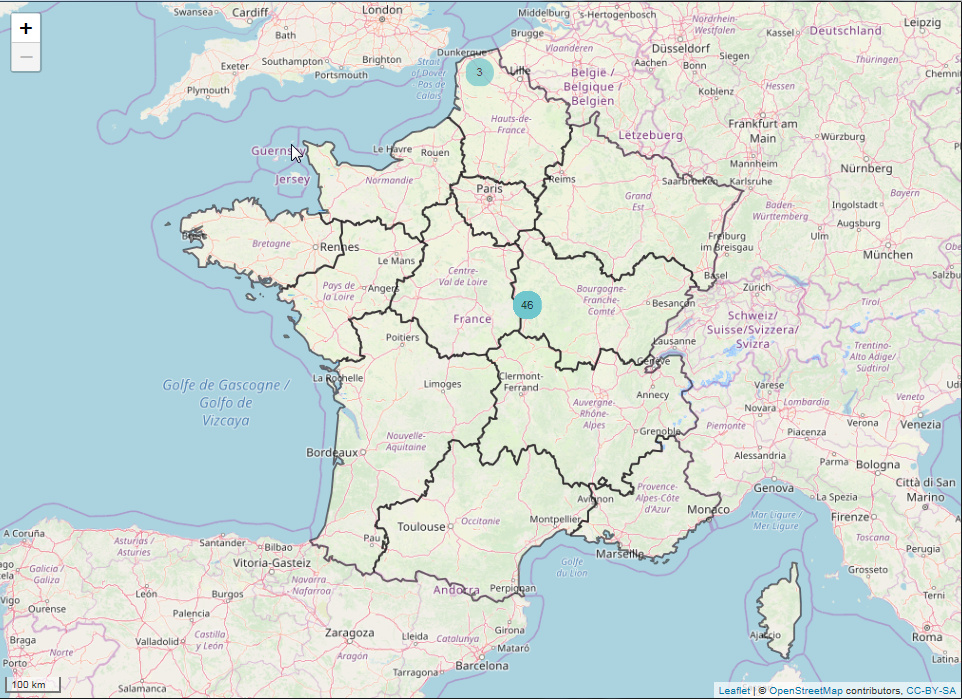
json_data_region <- rgdal::readOGR('json/region.geojson')
samp_leaflet <-
leaflet(samplee, options = leafletOptions(maxBoundsViscocity = 1, zoomDelta = 0.50)) %>%
setMaxBounds(
lng2 = 9.51,
lat2 = 41.43,
lng1 = -5.210,
lat1 = 51.13
) %>%
addTiles(options = tileOptions(minZoom = 6)) %>%
addPolygons(
data = json_data_region,
weight = 2,
fill = F,
color = 'black',
highlightOptions = highlightOptions(bringToFront = TRUE)
) %>%
addMarkers(
lng = ~ Longitude_ville,
lat = ~ Latitude_ville,
label = ~ n,
popup = ~ n,
group = "marker",
clusterOptions = markerClusterOptions(
iconCreateFunction = JS(
"function(cluster) {
var children = cluster.getAllChildMarkers();
var sum = 0;
for (var i = 0; i < children.length; i++) {
sum += children[i].options.popup;
console.log(children[i])
}
return new L.DivIcon({
html: '<div style=\"background-color: rgb(111,198,204); opacity : 0.7\"><span>' + sum + '</div><span>',
className: 'marker-cluster'
});
}"
)
,
spiderfyOnMaxZoom = FALSE,
removeOutsideVisibleBounds = TRUE,
singleMarkerMode = T
)
) %>% addScaleBar(position = "bottomleft", options = scaleBarOptions(imperial = FALSE))
# Print leaflet
samp_leaflet
Adding to this issue, i want to keep my map border, but adding polygons with markerCluster creates an overlay problem at the minimum zoom display. That's why resolve the first issue will sold the second one.