I have created a function, for getting summary of average, percentile. but not I want that summary for particular subsets. so I have created subsets accordingly.
but my function is not working properly.
so actually I am trying to update my function so that I can get a summary for list of variables as variable name and summary can be rbind for multiple list of variables.
I have no Idea how can i put "ALL", "MM" as name of variable in my function.
so that the summary for both can be rbind itself
df <- data.frame(Name = c("asdf","kjhgf","cvbnm","rtyui","cvbnm","jhfd","cvbnm","sdfghj","cvbnm","dfghj","cvbnm"),
                 sale=c(27,28,27,16,14,25,14,14,19,18,28),
                 city=c("CA","TX","MN","NY","TX","MT","HU","KL","TX","SA","TX"),
                 Dept = c("HH","MM","NN","MM","AA","VV","MM","HU","JJ","MM","ZZ"))


df1<- df
df$cc1<-1
df2<- subset(df, Dept == 'MM')
df$cc2<-ifelse(df$Dept == 'MM',1,NA)
lst<-list(df$cc1, df$cc2)
listd<-list("ALL" = df1, "MM" =df2)

#I want to run my function for listd so that i can get a  combined summary for all variables in listd
tt2<-function(data,var,footer,Name_of_variable,decimal){
  for (d in 1:length(data)) {
    cat('\n\n#### ', names(data)[d], '\n\n')
    md<-data[[d]]
    table_list<-list()
    for (i in 1:length(d))
      table_list[[i]]<-t1(md,var,footer,decimal,Name_of_variable)
    tt<- do.call(rbind,table_list)
  }
  cat(knit_print(tt))
  cat('\n\n')
}
t1<-function(dataset,var,Suff,decimal,Name_of_variable){
  numdig <- if (decimal == TRUE) {1} else {0}
  var <- rlang::parse_expr(var)
summ_tab1<- dataset %>% filter(!is.na(!!var)) %>%   summarise(
  q25 = format(round(quantile(!! var,  type=6, probs = seq(0, 1, 0.25), na.rm=TRUE)[2],digits = numdig),nsmall = numdig),
  Median = format(round(quantile(!! var, type=6, probs = seq(0, 1, 0.25), na.rm=TRUE)[3],digits = numdig),nsmall = numdig),
  Average = format(round( mean(!! var, na.rm=TRUE),digits = numdig),nsmall = numdig),
  q75 = format(round(quantile(!! var, type=6, probs = seq(0, 1, 0.25), na.rm=TRUE)[4],digits = numdig) ,nsmall = numdig),
  N = sum(!is.na(!!var)))
summ_tab<-summ_tab1 %>%
  mutate(" "=!!Name_of_variable,
         q25 = q25,
         Median =Median,
         Average =Average,
         q75 = q75)%>%
  dplyr::rename(
    `25th percentile` = q25,
    `75th percentile` = q75)%>%select(" ",N,everything())
summ_tab1
}


tt2(data = listd,var = "sale",Name_of_variable = "listd",decimal = TRUE)
Previously I was getting summary like below
| ALL | |||||
|---|---|---|---|---|---|
| q25 | Median | Average | q75 | N | |
| 1 | 14.5 | 17 | 19 | 25.5 | 4 |
| MM | |||||
| q25 | Median | Average | q75 | N | |
| 1 | 14.5 | 17 | 19 | 25.5 | 4 |
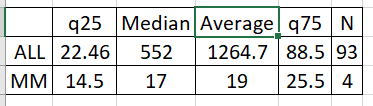
but now the output summary should be like , name of variable should be in rows.