I have a function which is creating table one by one for the list of banner. but now want to show them as binding as cbind.
so it should be displayed horizontally according to banner.
library(knitr)
library(tidyverse)
library(flextable)
banner <- c("All","Other")
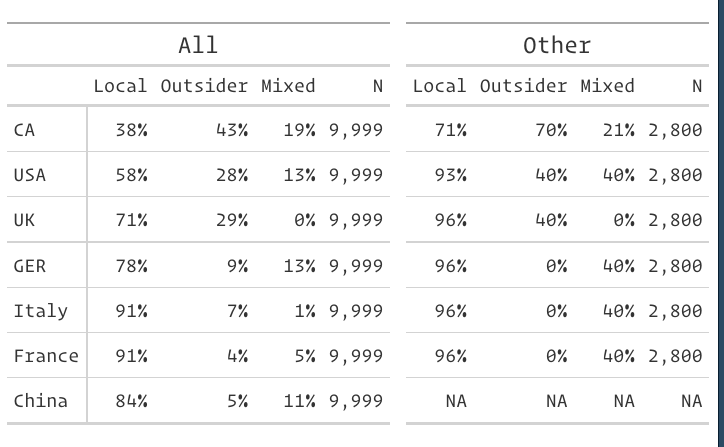
t1 <- structure(list(` ` = c("CA", "USA","UK", "GER", "Italy","France", "China"),
Local = c("38%", "58%","71%", "78%", "91%", "91%", "84%"),
Outsider = c("43%", "28%", "29%"," 9%", " 7%", " 4%", " 5%"),
Mixed = c("19%","13%", " 0%", "13%", " 1%", " 5%", "11%"),
N = c("9999", "9999","9999", "9999", "9999", "9999", "9999")), row.names = c(NA, -7L), class = "data.frame")
t2 <- structure(list(` ` = c("CA", "USA","UK", "GER", "Italy","France", "China"),
Local = c("71%", "93%","96%", "96%", "96%", "96%", NA),
Outsider = c(" 7%", " 4%", " 4%"," 0%", " 0%", " 0%", NA),
Mixed = c("21%"," 4%", " 0%", " 4%", " 4%", " 4%", NA),
N = c("2800", "2800","2800", "2800", "2800", "2800", NA)), row.names = c(NA, -7L), class = "data.frame")
tl <- list(t1,t2)
fun1 <- function(tl,banner){
for (i in 1:length(banner))
{
cat("\n \\newline \n")
cat("\n\n### ", banner[[i]], "\n\n")
t_list <- list()
t1 <- tl[[i]]
t1 <- t1 %>% flextable()
cat(knit_print(t1))
}
cat("\n\n")
}
fun1(tl=tl,banner = banner)
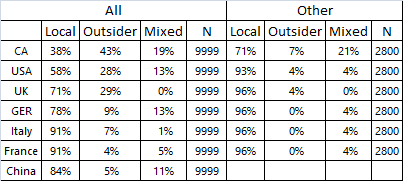
the output should look like