I am trying to create a bar graph in ggplot for multiple variables, but I can only manage to create a stacked bar graph. However, I want the variables side by side with their own bars.
My dataset:
Hm# A tibble: 30 x 5
Year MackerelMean Mackerelse SardineMean Sardinese
<fct> <dbl> <dbl> <dbl> <dbl>
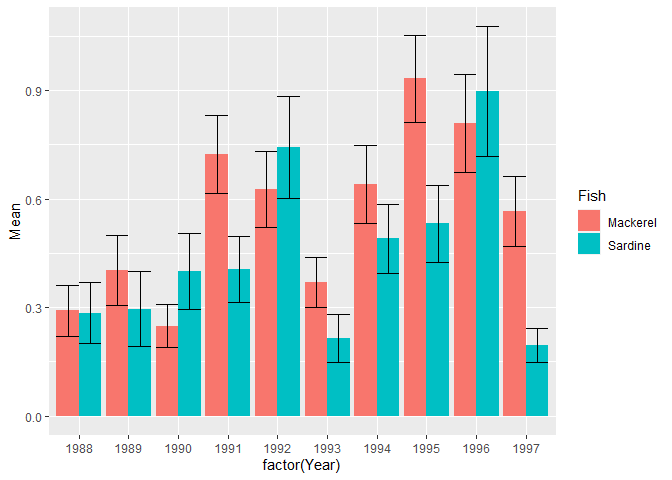
1 1988 0.291 0.0702 0.285 0.0848
2 1989 0.403 0.0974 0.296 0.105
3 1990 0.249 0.0586 0.400 0.106
4 1991 0.723 0.108 0.405 0.0914
5 1992 0.627 0.106 0.743 0.142
6 1993 0.370 0.0696 0.214 0.0673
7 1994 0.641 0.108 0.490 0.0966
8 1995 0.933 0.121 0.532 0.106
9 1996 0.809 0.136 0.898 0.179
10 1997 0.565 0.0966 0.195 0.0460
This is the code I've tried that creates a stacked bar graph:
ggplot(Hm) +
  geom_bar(aes(x=Year, y=MackerelMean), stat="identity",
           fill="forestgreen", alpha=0.7) +
  geom_bar(aes(x=Year, y=SardineMean), stat="identity",
           fill = "grey2") +
  scale_x_discrete(breaks=seq(1988, 2017, by = 3))
But I want MackerelMean and SardineMean to have their own independent bars relative to Year. Also, I want to include geom_errorbars based on the standard error values (Mackerelse and Sardinese) but I'm not sure how to incorporate separate geom error bars.
So that it's
geom_errorbar( aes(x=Year, ymin=MackerelMean-Mackerelse, ymax=MackerelMean+Mackerelse)
and
geom_errorbar( aes(x=Year, ymin=SardineMean-Sardinese, ymax=SardineMean+Sardinese)
Thanks.