Hi. I am trying to reproduce an article's simulations (this is the article: OSF), however some errors have been occouring, which I think I've been able to solve. Nevertheless, one of the final graphs is incomplete. It has the x and the y-axis, it has the legends and so on, but the lines do not appear. The printscreen of the R code and the graph is attached. Can someone please help? I've trying to solve this for a week.
Thank you in advance.
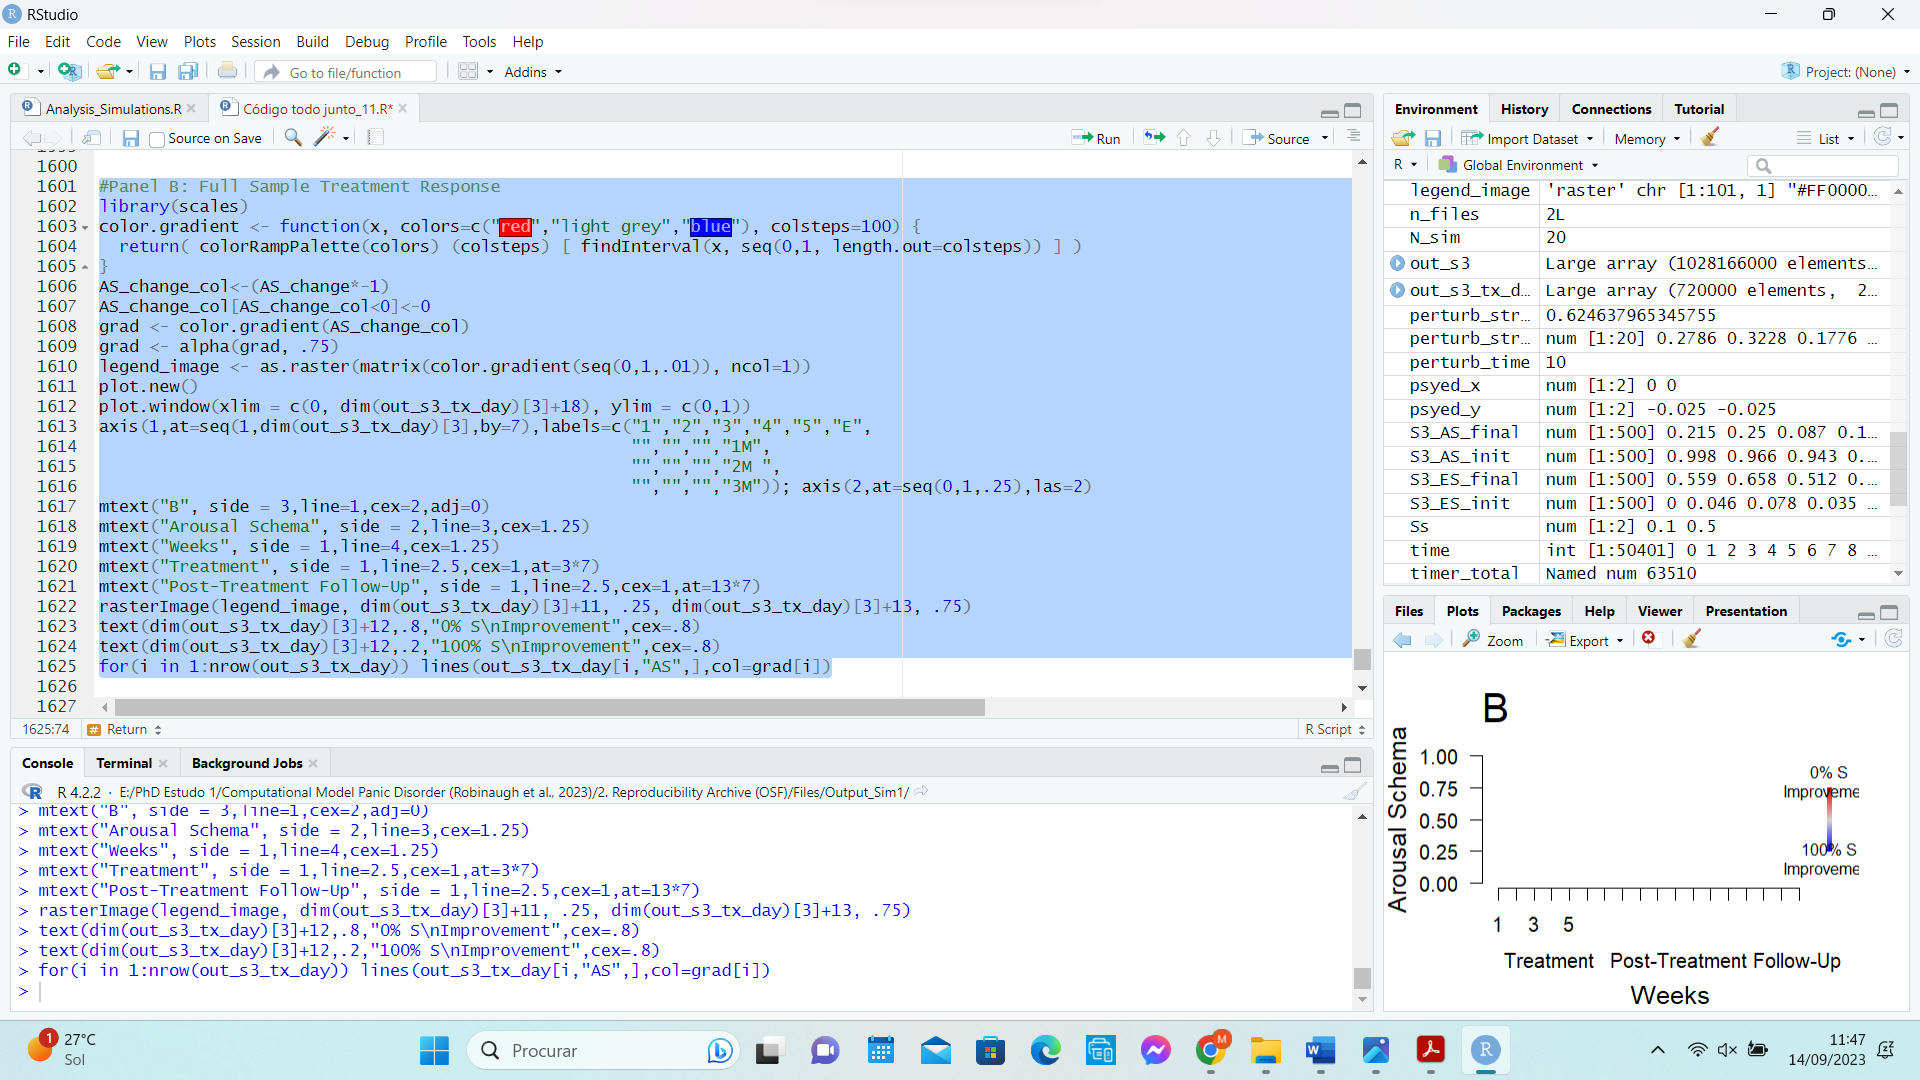
does it have the x axis ? it seems wrong; 1 , 3, 5 ... nothing else ...
You're right. In the meanwhile I figured out what else was wrong. Thank you for your help.
This topic was automatically closed 42 days after the last reply. New replies are no longer allowed.
If you have a query related to it or one of the replies, start a new topic and refer back with a link.