( long question)
In sparklyr, the usage of mutate in a window function way generates strangely different sql.
Create dataset:
library("tidyverse")

# a user's total transaction per day is recorded. If there is no transactions by the user on a particular day,
# then there is no row.

set.seed(100)
rep_df =
  tibble::tibble(
    user_id = sample(1:100, 1000, replace = TRUE),
    dates   = seq(as_date("2024-01-01"), as_date("2024-02-01"), 1) %>%
                sample(1000, replace = TRUE),
    amount  = sample(seq(100, 900, 100), 1000, replace = TRUE)
    ) %>%
  summarise(amount = sum(amount), .by = c(user_id, dates))

rep_df
   user_id dates      amount
     <int> <date>      <dbl>
 1      74 2024-01-23   1500
 2      89 2024-01-29    100
 3      78 2024-02-01    300
 4      23 2024-01-07    700
 5      86 2024-01-16   1100
 6      70 2024-01-18    400
 7       4 2024-01-08    600
 8      55 2024-01-14    600
 9      70 2024-01-28    900
10      98 2024-01-04   1300
Intent: Create an array of all previous transactions per row.
# standard tidyverse code
rep_df %>%
  arrange(user_id, dates) %>%
  group_by(user_id) %>%
  mutate(prev_amounts = slider::slide(amount,
                                      identity,
                                     .before = Inf,
                                     .after = -1
                                     )
         ) %>%
  ungroup()
provides the expected output
# A tibble: 852 × 4
   user_id dates      amount prev_amounts
     <int> <date>      <dbl> <list>
 1       1 2024-01-01    400 <dbl [0]>
 2       1 2024-01-02    200 <dbl [1]>
 3       1 2024-01-04    800 <dbl [2]>
 4       1 2024-01-05    800 <dbl [3]>
 5       1 2024-01-10    900 <dbl [4]>
 6       1 2024-01-12    900 <dbl [5]>
 7       1 2024-01-17    500 <dbl [6]>
 8       1 2024-01-26    100 <dbl [7]>
 9       1 2024-01-29    300 <dbl [8]>
10       2 2024-01-01   1000 <dbl [0]>
# ℹ 842 more rows
# ℹ Use `print(n = ...)` to see more rows
Consider, rep_sdf to the spark counterpart of rep_df.
The following code creates the expected sql:
rep_sdf %>%
  group_by(user_id) %>%
  dbplyr::window_order(dates) %>%
  dbplyr::window_frame(-Inf, -1) %>%
  mutate(mean_amount = mean(amount)) %>% # note 'mean' here
  dbplyr::sql_render()
sql generated:
SELECT
    *,
    AVG(`amount`) OVER (PARTITION BY `user_id` ORDER BY `dates` ROWS BETWEEN UNBOUNDED PRECEDING AND 1 PRECEDING) AS `mean_amount`
  FROM `rep_df_25d9a1bd_db0c_4fb2_9289_6054fdf2749e`
Lets try to do what we did with tidyverse code:
rep_sdf %>%
  group_by(user_id) %>%
  dbplyr::window_order(dates) %>%
  dbplyr::window_frame(-Inf, -1) %>%
  mutate(list_amount = collect_list(amount)) %>% # note 'collect_list' instead of 'mean' here
 # mutate(list_amount = sql("collect_list(amount)")) %>% # this does not work either
  dbplyr::sql_render()
This generated the following sql:
SELECT *, collect_list(`amount`) AS `list_amount`
FROM `rep_df_25d9a1bd_db0c_4fb2_9289_6054fdf2749e`
Problem:
- All window information is lost!
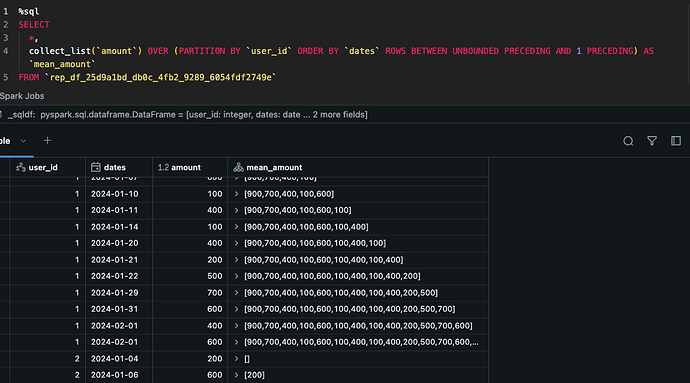
For my surprise, changing the word 'AVG' to 'collect_list' in the valid sql (generated using 'mean') works:
sdf_sql(con, "
               SELECT
  *,
  collect_list(`amount`) OVER (PARTITION BY `user_id` ORDER BY `dates` ROWS BETWEEN UNBOUNDED PRECEDING AND 1 PRECEDING) AS `mean_amount`
FROM `rep_df_25d9a1bd_db0c_4fb2_9289_6054fdf2749e`")
Questions:
- Is there a different canonical way to achieve this with dplyr?
- Is this a bug or shortcoming?
