As the bar width is increased for this plot of number of nests over time, more bars appear or overlap. Not sure what is going on here. I need some elucidation. Could this have been done with geom_col? I tried but could not get it to work.
Thanks,
Jeff
library(tidyverse)
library("gridExtra")
#>
#> Attaching package: 'gridExtra'
#> The following object is masked from 'package:dplyr':
#>
#> combine
library("reprex")
turtle_activity_gtm_nest_date <- read_csv("https://www.dropbox.com/s/nkqtfvtug46r4w6/turtle_activity_report_nest_date.csv?dl=1")
#> Rows: 765 Columns: 6
#> ── Column specification ────────────────────────────────────────────────────────
#> Delimiter: ","
#> chr (4): activity, ref_no, activity_date, species
#> dbl (2): latitude, longitude
#>
#> ℹ Use `spec()` to retrieve the full column specification for this data.
#> ℹ Specify the column types or set `show_col_types = FALSE` to quiet this message.
#view(turtle_activity_gtm_nest_date)
turtle_activity_gtm_nest_date$activity_nest_date <-
as.Date(turtle_activity_gtm_nest_date$activity_date,format="%m/%d/%Y")
#Ignore first nest with odd-ball date for the moment.
#view(turtle_activity_gtm_nest_date)
turtle_activity_gtm_only_nest_date <- turtle_activity_gtm_nest_date |> filter(activity=="N")
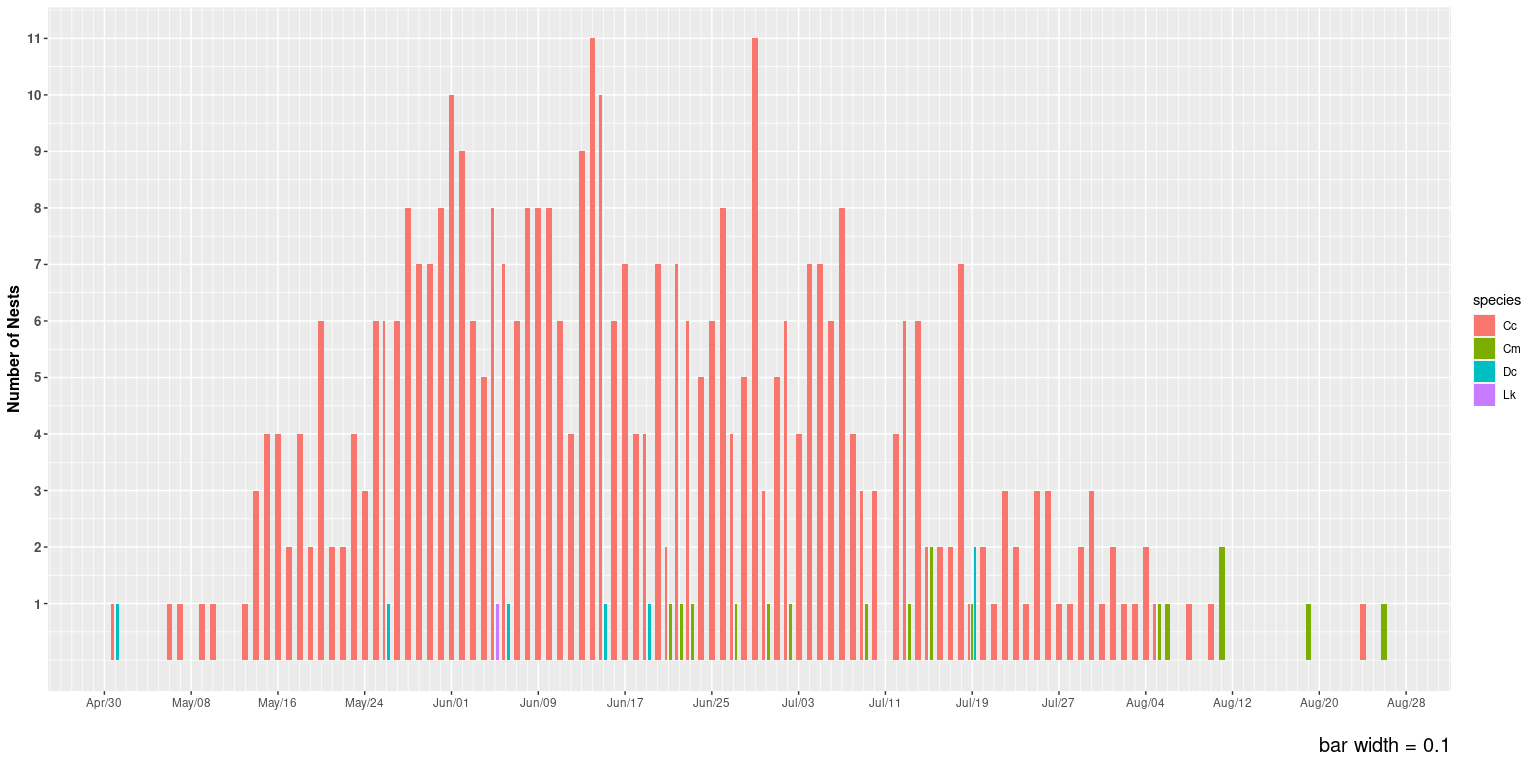
plot1 <-
ggplot() +
geom_bar(data = turtle_activity_gtm_only_nest_date,
aes(x = activity_nest_date, fill = species),
width = 0.1,
position = position_dodge(width = 0.9)) +
scale_x_date(date_breaks = "8 day", date_labels = "%b/%d") +
scale_y_continuous(breaks = 1:12) +
labs(x="",y="Number of Nests", caption="bar width = 0.1") +
theme(axis.text.y = element_text(face = "bold",
size = 10, angle = 0),
# legend.position=c(2022-07-22, 8),
axis.title = element_text(size = 12, face = "bold"),
plot.caption = element_text(size = 15))
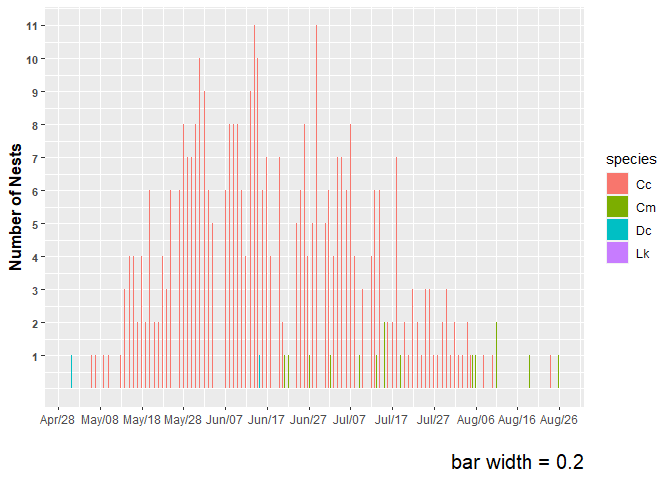
plot2 <-
ggplot() +
geom_bar(data = turtle_activity_gtm_only_nest_date,
aes(x = activity_nest_date, fill = species),
width = 0.2,
position = position_dodge(width = 0.9)) +
scale_x_date(date_breaks = "10 day", date_labels = "%b/%d") +
scale_y_continuous(breaks = 1:12) +
labs(x="",y="Number of Nests", caption="bar width = 0.2") +
theme(axis.text.y = element_text(face = "bold",
size = 8, angle = 0),
# legend.position=c(2022-07-22, 8),
axis.title = element_text(size = 12, face = "bold"),
plot.caption = element_text(size = 15))
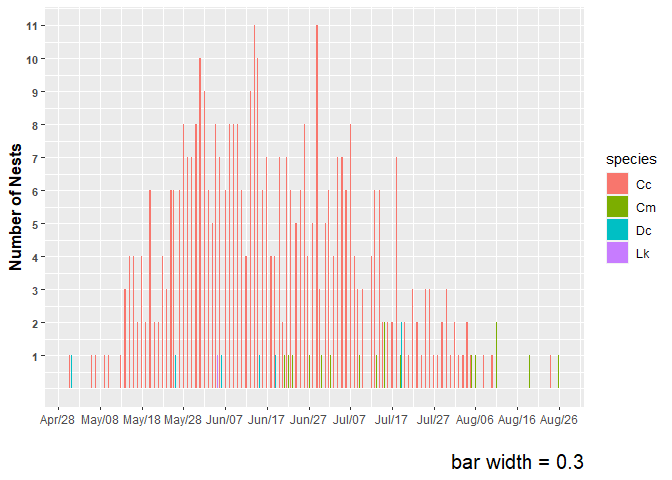
plot3 <-
ggplot() +
geom_bar(data = turtle_activity_gtm_only_nest_date,
aes(x = activity_nest_date, fill = species),
width = 0.3,
position = position_dodge(width = 0.9)) +
scale_x_date(date_breaks = "10 day", date_labels = "%b/%d") +
scale_y_continuous(breaks = 1:12) +
labs(x="",y="Number of Nests", caption="bar width = 0.3") +
theme(axis.text.y = element_text(face = "bold",
size = 8, angle = 0),
# legend.position=c(2022-07-22, 8),
axis.title = element_text(size = 12, face = "bold"),
plot.caption = element_text(size = 15))
plot1
#> Warning: Removed 1 rows containing non-finite values (`stat_count()`).
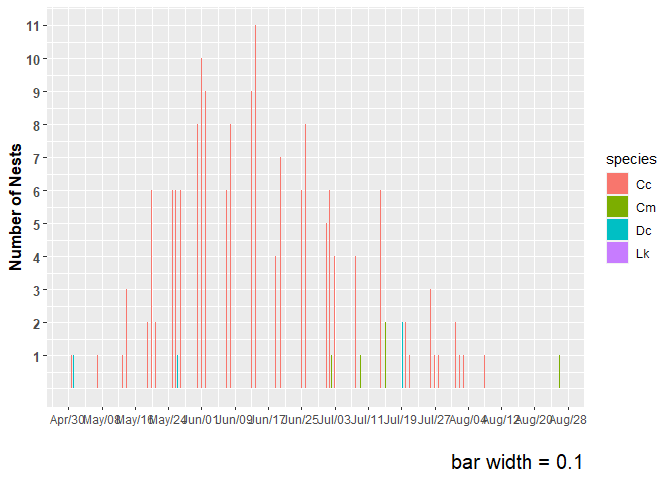
plot2
#> Warning: Removed 1 rows containing non-finite values (`stat_count()`).
plot3
#> Warning: Removed 1 rows containing non-finite values (`stat_count()`).
Created on 2023-01-05 with reprex v2.0.2