I am currently working on debugging a rather complex Shiny application, and in the process, I've encountered an issue related to the reactivity chain. It seems that the application is loading a plot output twice in quick succession, and I am trying to decipher why this might be happening using the reactlog module.
While I intend to troubleshoot the code on my own, my main focus here is to gain a better understanding of the reactlog diagram that I've generated for this application.
Upon examining the diagram, I've noticed that there are multiple duplicates of the end points. Here is a screenshot of the diagram with a pink line highlighting one of the instances of such duplication:
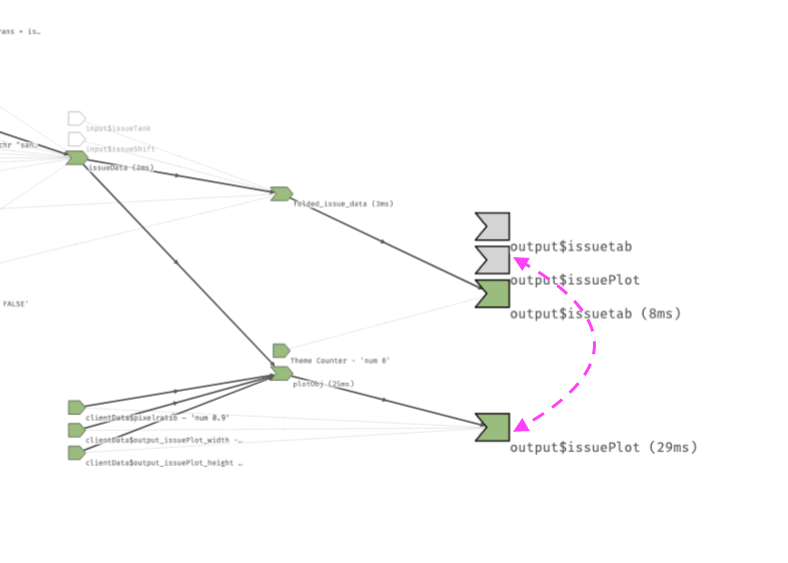
I'm currently uncertain if these duplicates are a normal part of the reactlog diagram or if they indicate an issue with my code. Could anyone with experience in reading these diagrams please shed some light on this?
Thank you for your assistance!
Referred here by reactlog's README