Here is my last ditch attempt to understand what is happening with a bit of code 
I have seen this blog post which describes ctrees in a very understandable manner (for me in any case :). Unfortunately they do not go into the variable importance in great detail
According to the original authors 1, 2, the Z data-frame or conditional grid described in the original paper is a data-frame where the columns are the rules of the individual rules of each decision tree. Here is where i get lost again :). The paper says
The set of variables Z to be conditioned on should contain all variables that are correlated with the current variable of interest X_j. In the varimp function,this is assured by the small default value 0.2 of the threshold argument: By default, all variables whose correlation with X_j meets the condition 1 - (p-value) > 0.2 are used for conditioning. A larger value of threshold would have the effect that only those variables that are strongly correlated with Xj would be used for conditioning, but would also lower the computational burden.
So if I understand this correctly,
- You first determine the variables to use, using the threshold for your 1-(p-value)
- You remove all variables with a lower correlation than the threshold (this can be correlation for numeric numbers or p-values for measures of association)
- Then you generate the trees with the new set of attributes
- You create your Z data-frame based on the cut-points (rules)
- Within each grid generated from the tree you permutate the variable you are interested in
- The value of the non permutated performance vs the performance with the permutated performance gives you the variable importance
- This is then averaged over all of the trees to see the total result
I think this would make more sense to me if I tried to see Z looks like
Z is created below based on the rules with a single Tree but where does the variable i want to use go within Z?
Apologies if I appear to be laboring the point
library(party)
library(janitor)
library(tidyverse)

# Create a dataframe where we are trying to predict Setosa
mydf <- iris %>%
  mutate(set_tgt = factor(ifelse(Species == 'setosa', 'yes', 'no'))) %>%
  select(-Species)

glimpse(mydf)
#> Observations: 150
#> Variables: 5
#> $ Sepal.Length <dbl> 5.1, 4.9, 4.7, 4.6, 5.0, 5.4, 4.6, 5.0, 4.4, 4.9,...
#> $ Sepal.Width  <dbl> 3.5, 3.0, 3.2, 3.1, 3.6, 3.9, 3.4, 3.4, 2.9, 3.1,...
#> $ Petal.Length <dbl> 1.4, 1.4, 1.3, 1.5, 1.4, 1.7, 1.4, 1.5, 1.4, 1.5,...
#> $ Petal.Width  <dbl> 0.2, 0.2, 0.2, 0.2, 0.2, 0.4, 0.3, 0.2, 0.2, 0.1,...
#> $ set_tgt      <fct> yes, yes, yes, yes, yes, yes, yes, yes, yes, yes,...

# We will try to predict "set_tgt"
cf_mod <- cforest(set_tgt ~ .,
                  data = mydf,
                  control = cforest_unbiased(mtry = 2, ntree = 3))

# If we use conditional set to true it permutates the variables
# based on the threshold
varimp(cf_mod, conditional = TRUE, threshold = 0.2) %>%
  enframe() %>%
  arrange(desc(value))
#> # A tibble: 4 x 2
#>   name         value
#>   <chr>        <dbl>
#> 1 Petal.Length  0.40
#> 2 Sepal.Length  0
#> 3 Sepal.Width   0
#> 4 Petal.Width   0

# Finding Z
mod <- ctree(set_tgt ~ .,data = mydf)
plot(mod)
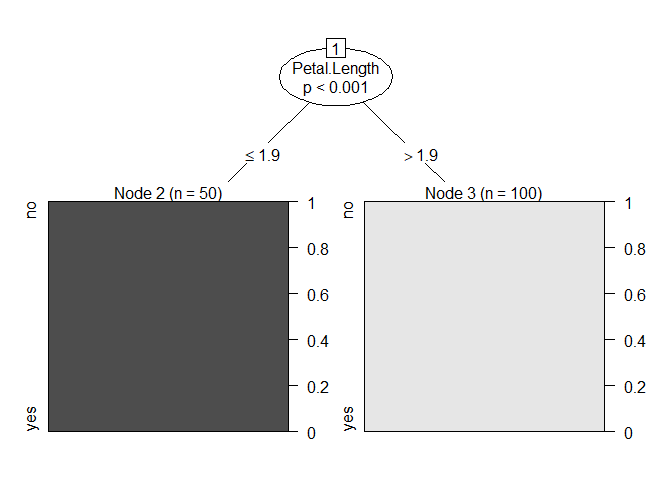
# Row names are the label we are trying to predict
Z <- tibble("Petal.Length <= 1.9" = 50,
            "Petal.Length > 1.9" = 0) %>%
  bind_rows(tibble("Petal.Length <= 1.9" = 0,
                   "Petal.Length > 1.9" = 100)) %>%
  data.frame() %>%
  clean_names()

row.names(Z) <- c("no", "yes")

Z
#>     petal_length_1_9 petal_length_1_9_2
#> no                50                  0
#> yes                0                100
Created on 2020-03-22 by the reprex package (v0.2.1)